Designing the Future
of Digital Experiences
Marcello Annicchiarico — Crafting premium, high-conversion web interfaces with state-of-the-art tech.
About Me
Beyond the Code
The Architect
I bridge the gap between form and function through an AI-augmented development flow. From automated unit testing to real-time code optimization, I leverage an intelligent toolchain to build faster and more reliably, ensuring that every pixel is perfect and every backend system is bulletproof.

Download CV
View my full resume
Selected Works
Building the Extraordinary
7echno
Music Experience
EVA Global
heatmap
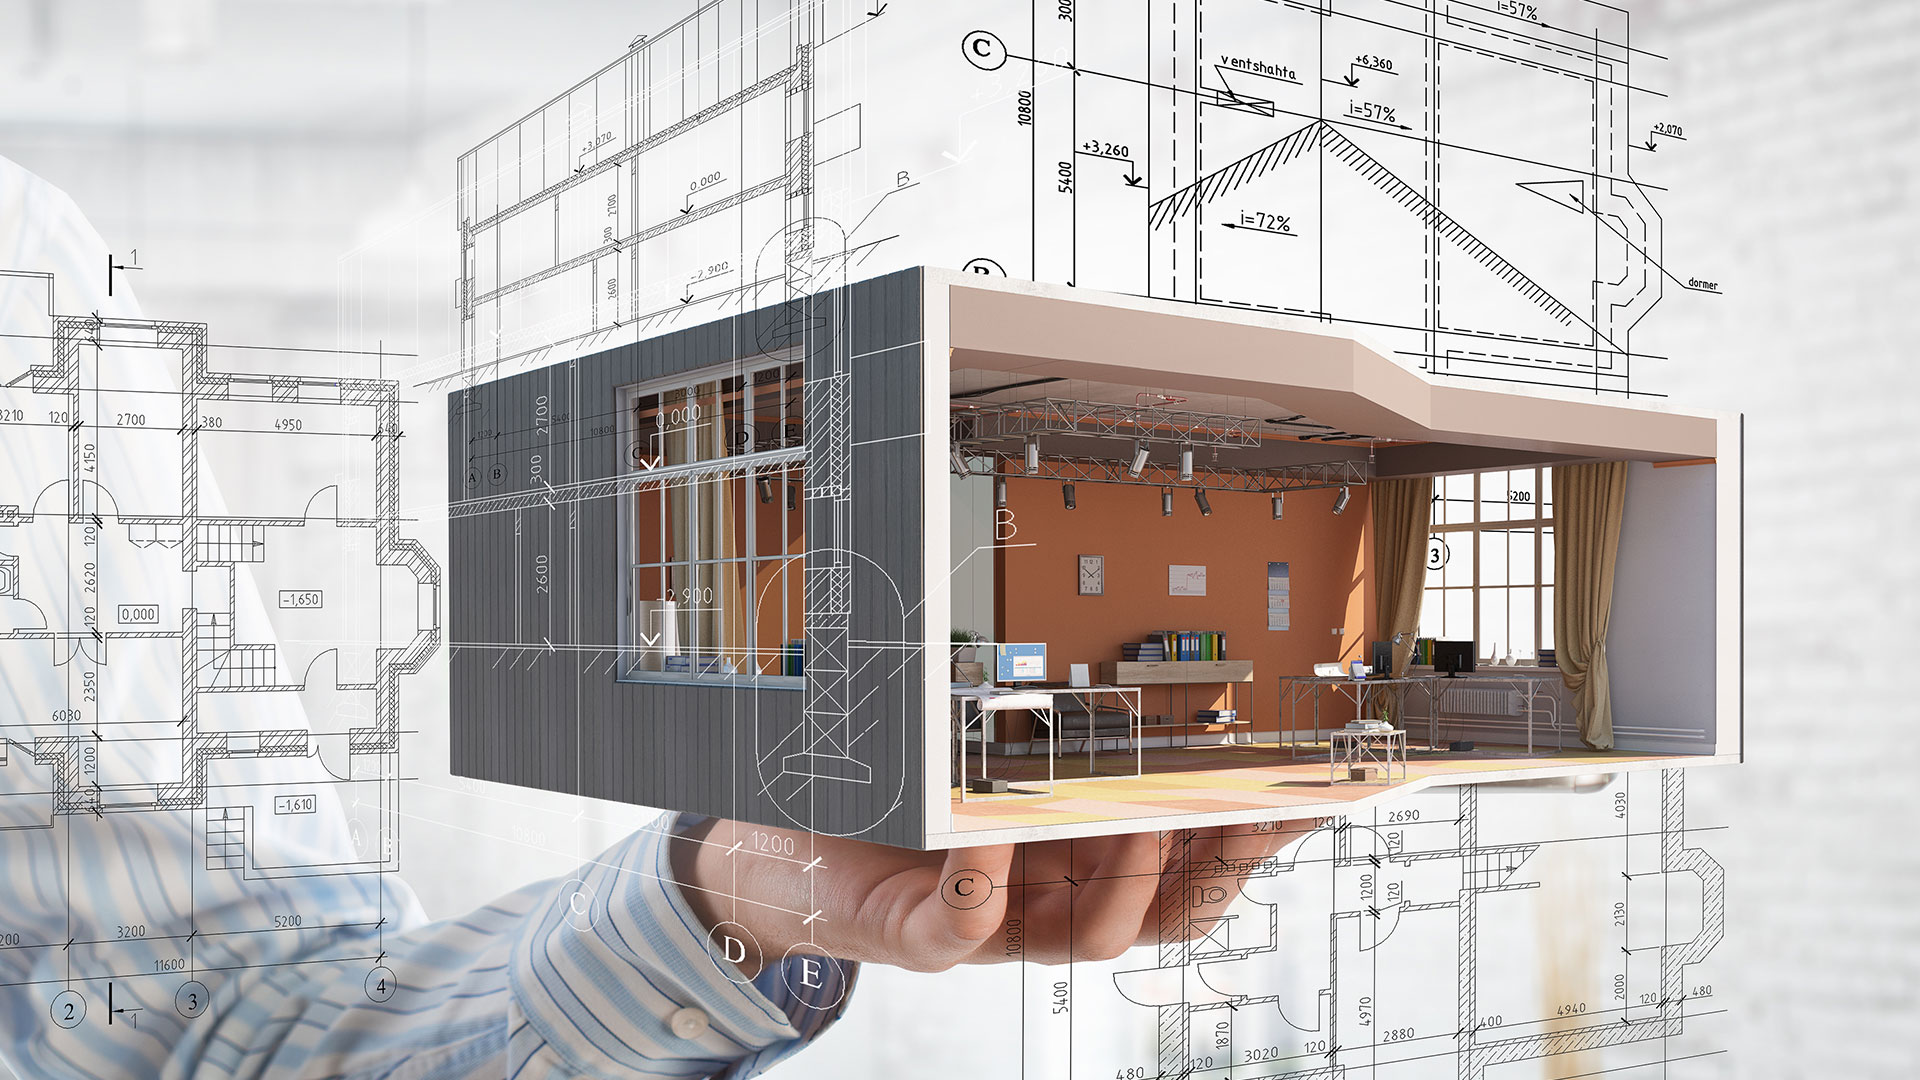
Buildingminds
Manager
YUKKA Lab
Chartmap
Buildingminds
UI Components

Yukka Lab
Network
Mineko
Nebenkosten
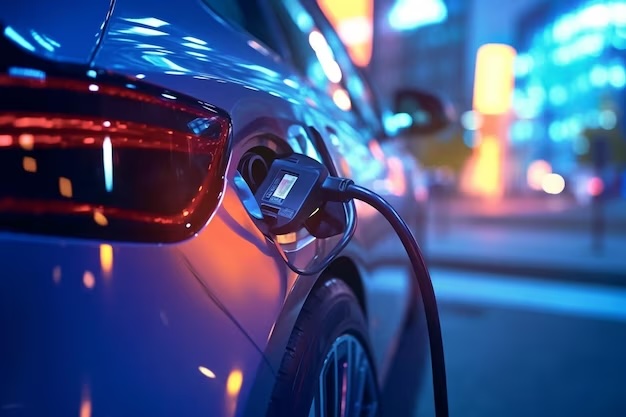
EVA Global
Monitoring
Fastrack
Check In Quick
Github Issue
Mobile App
Buildingminds
UI Components

Mineko
Uploader
Career Journey
Professional Experience
Fast Track
Frontend AI Leader
Flight Tickets

Eva Global
Frontend Developer
eMobility
Linus
Frontend Developer
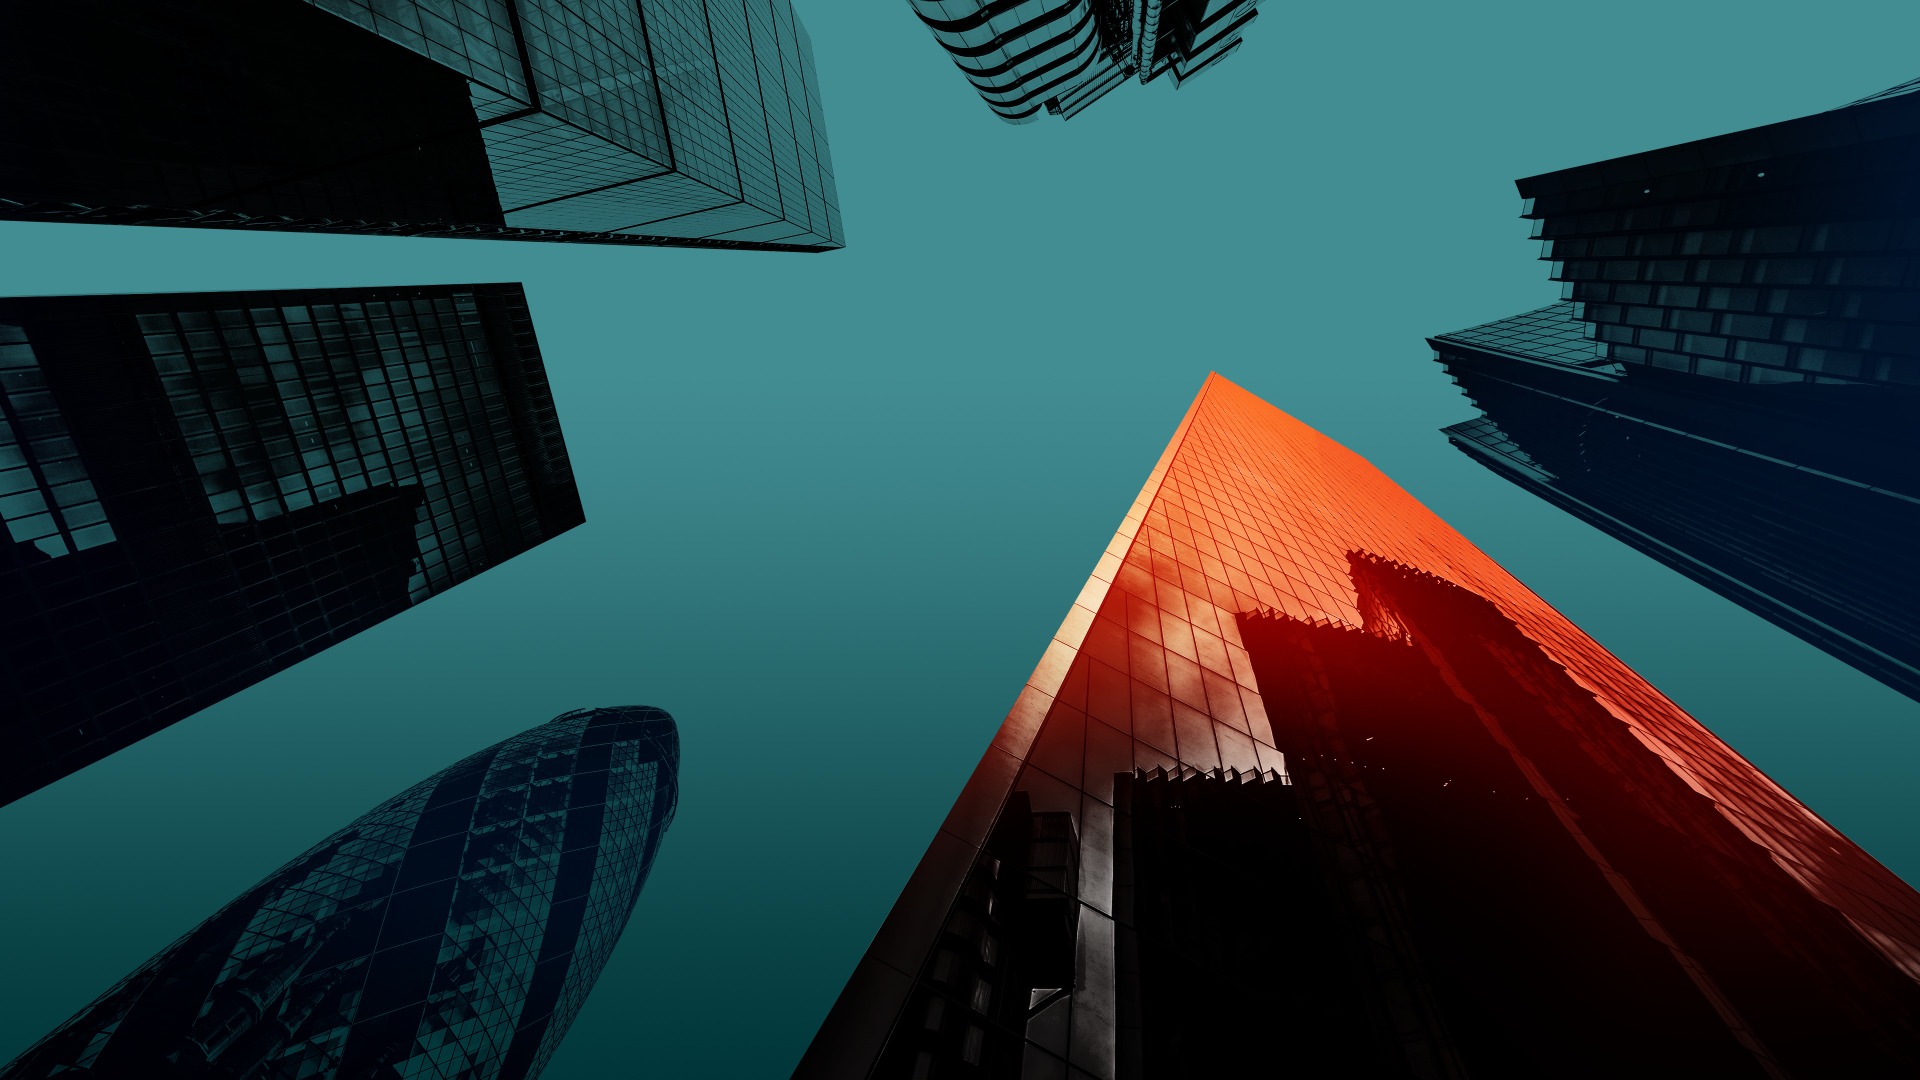
Digital Finance
Buildingminds
Frontend Developer
Equipment Tool
Yukkalab
Frontend Developer
News analytics
Smava
Frontend Developer
Credit Online
Personal Side Project
Streaming Platform
Loading project...
Get In Touch
Let's Build Something
I'm always open to discussing new projects, creative ideas, or opportunities to be part of your vision.
Send me an EmailBased in Berlin DE • Available for remote opportunities worldwide