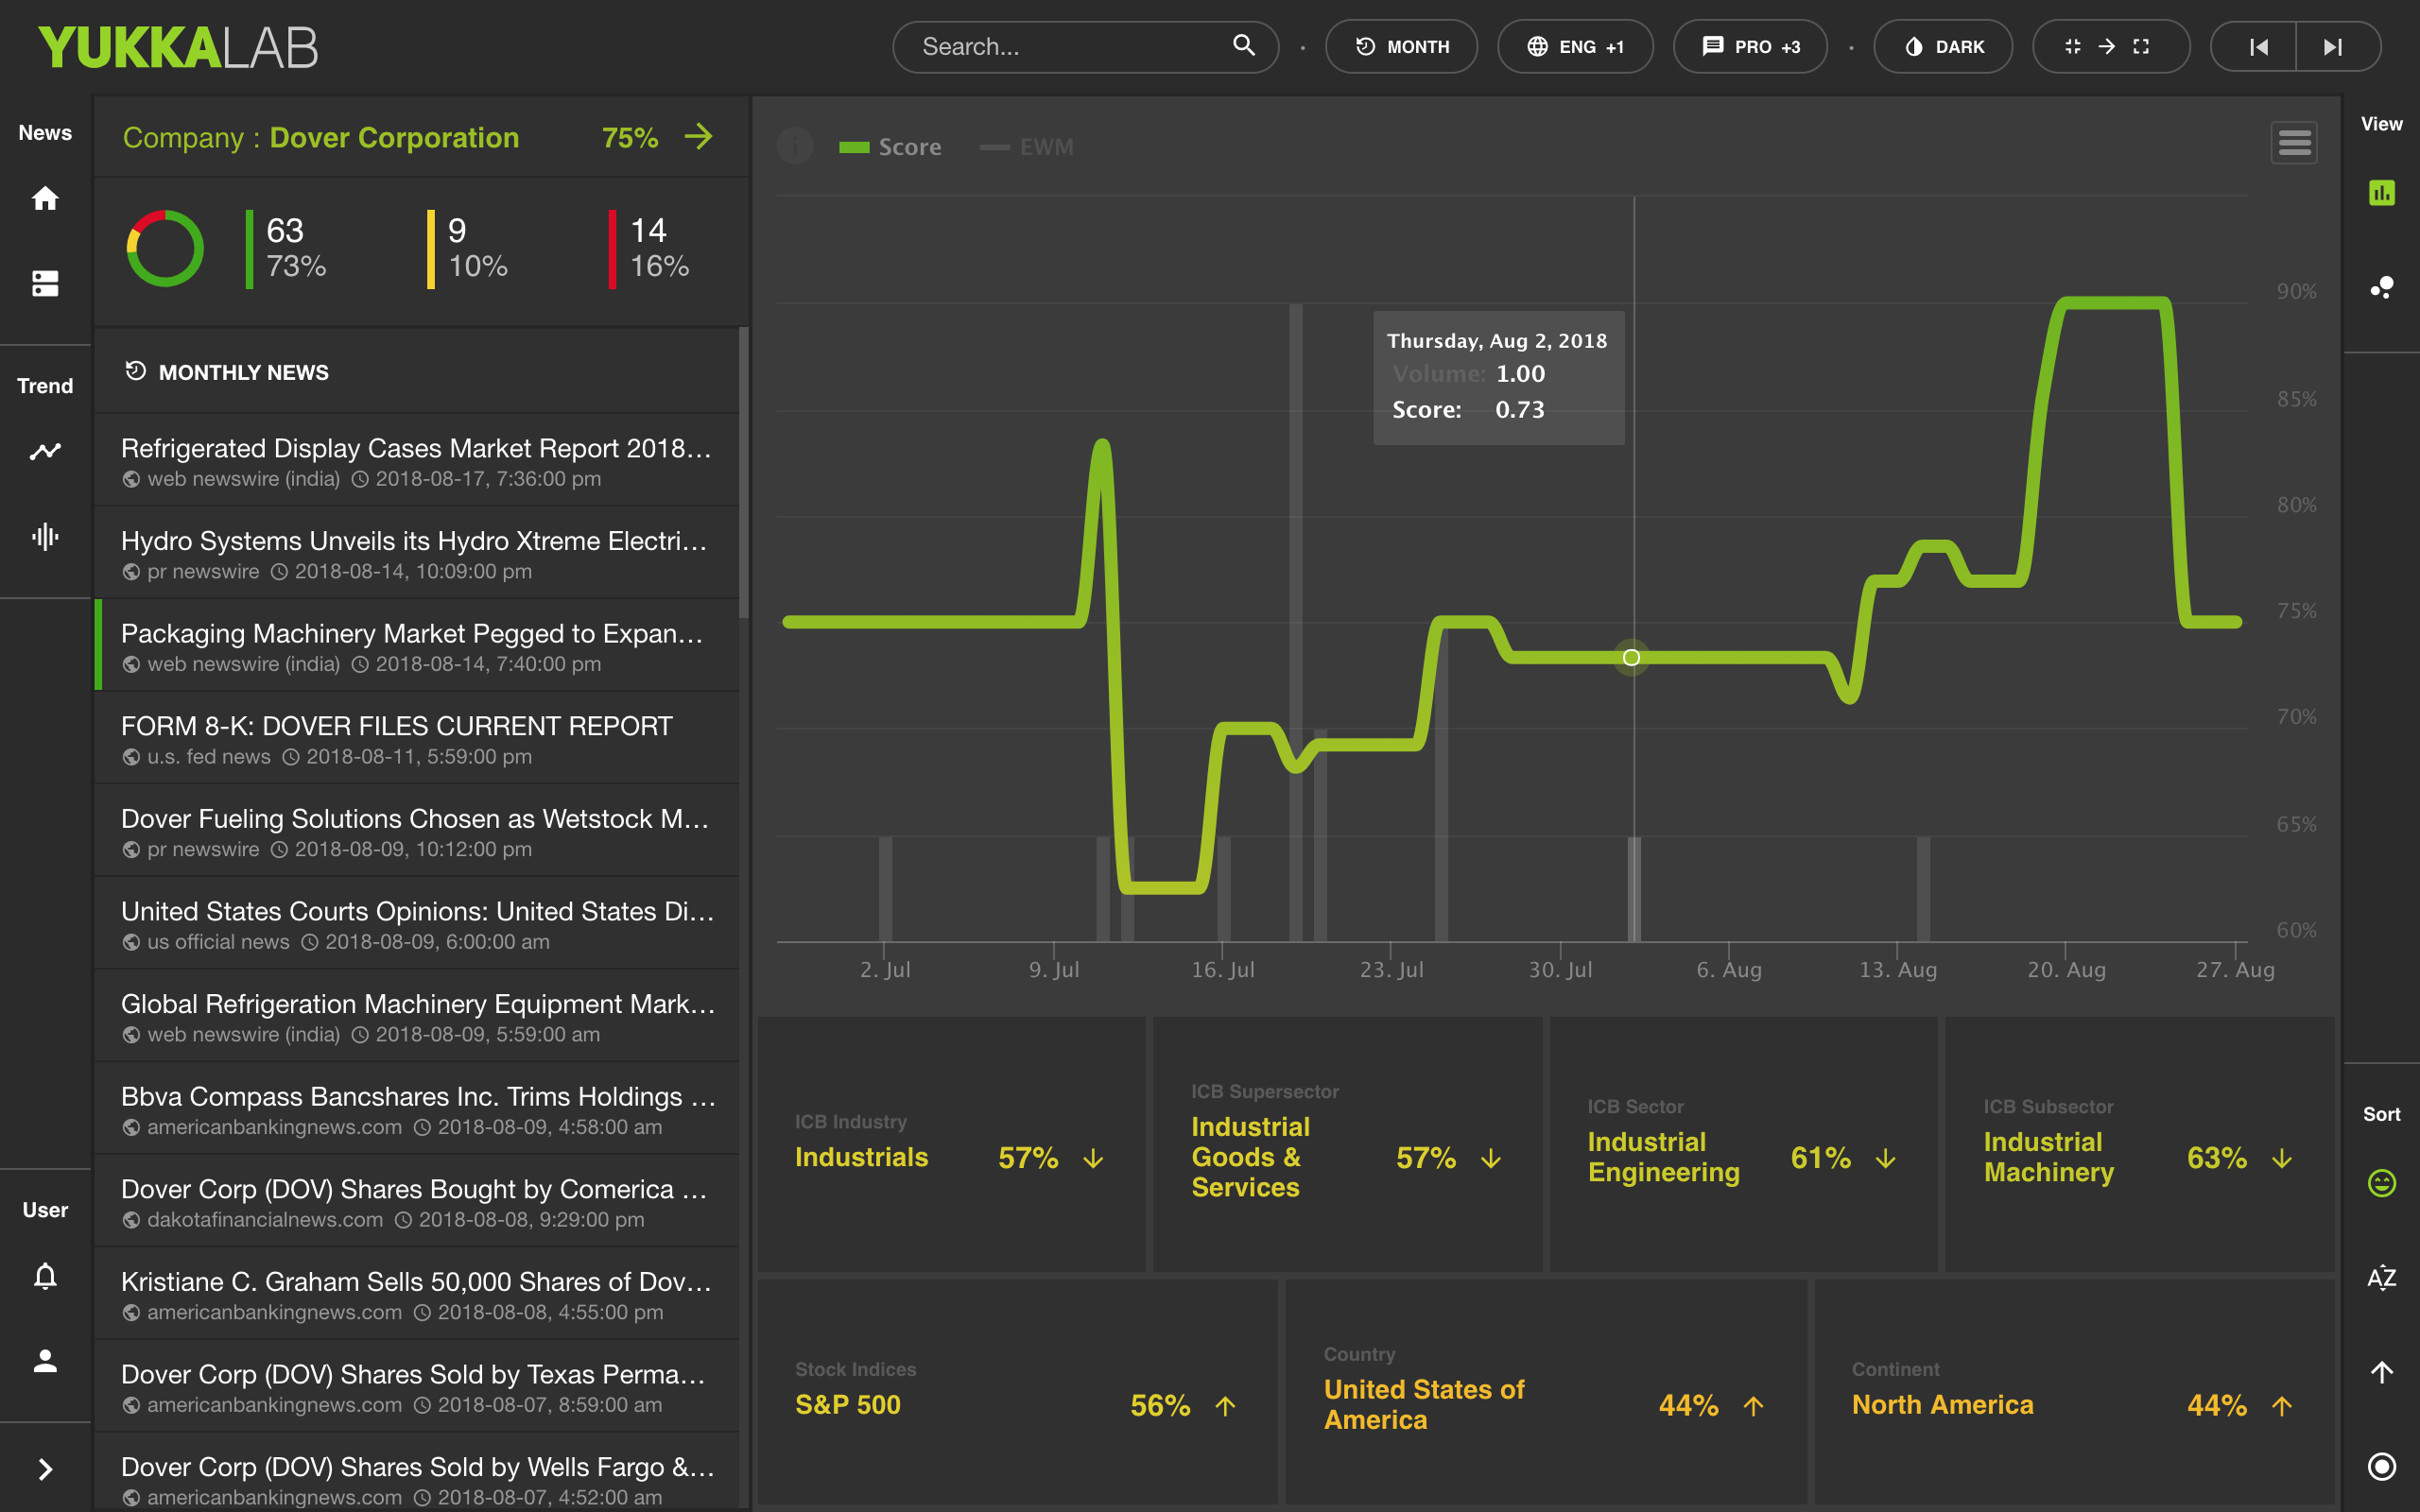
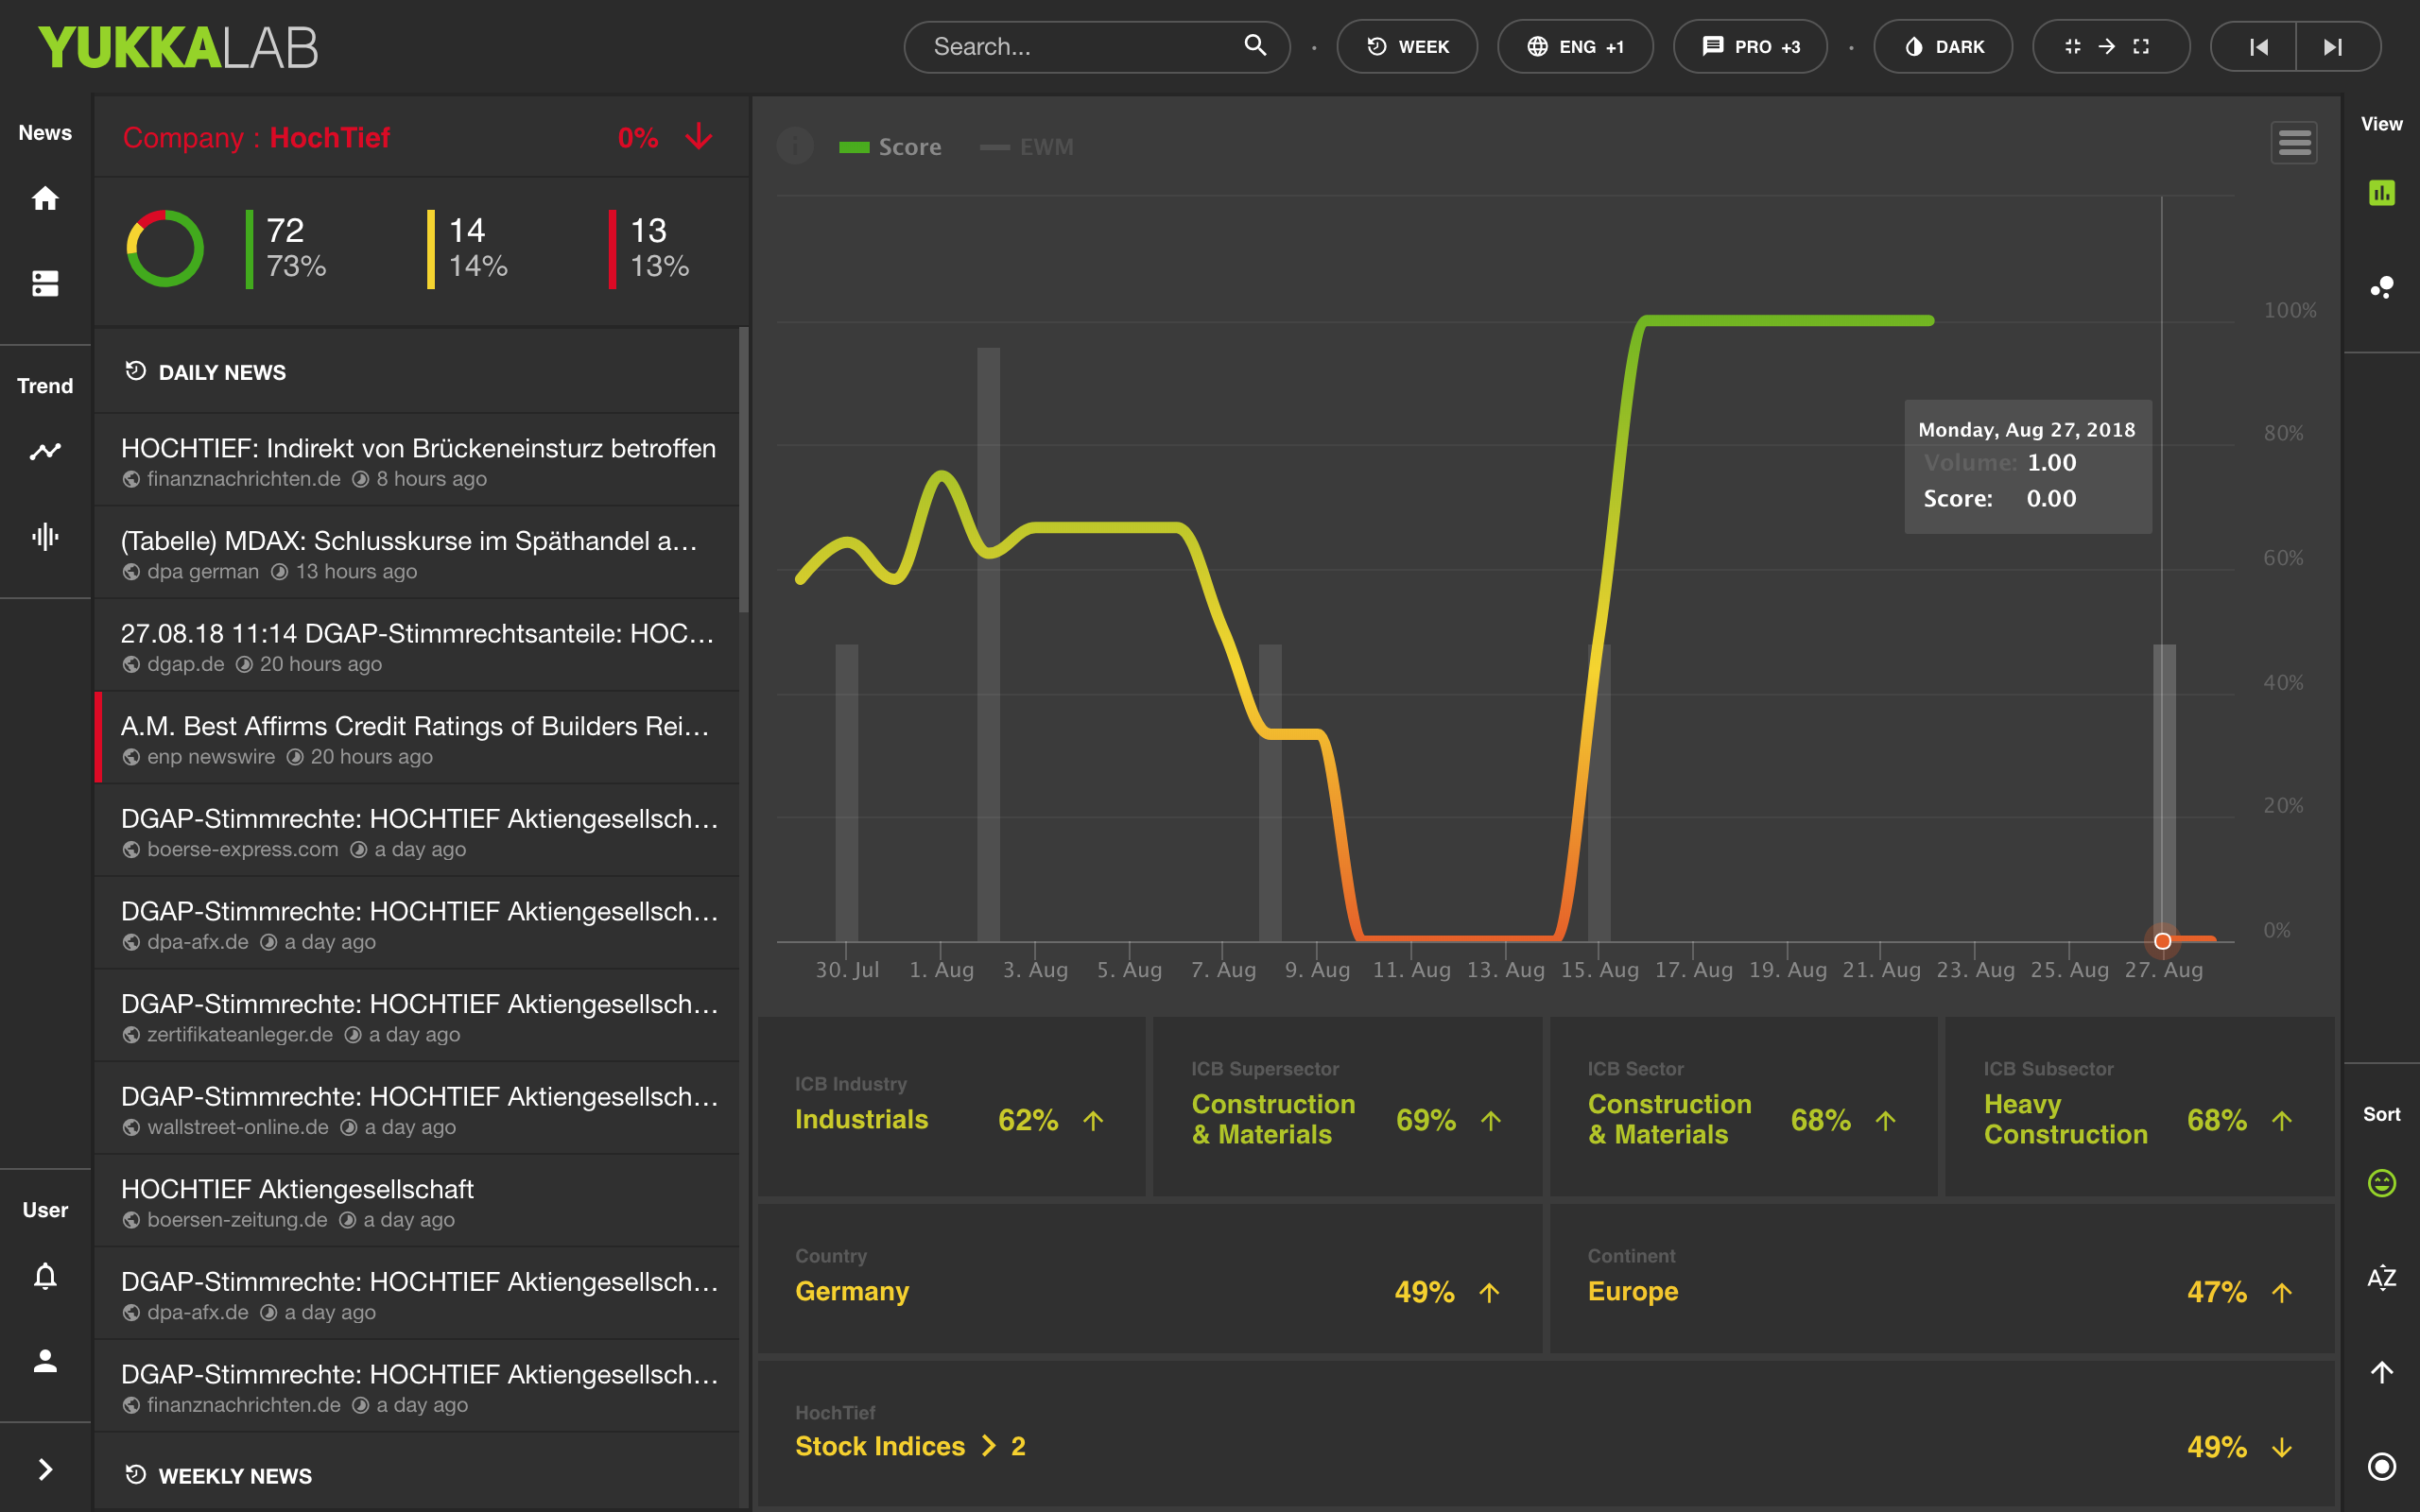
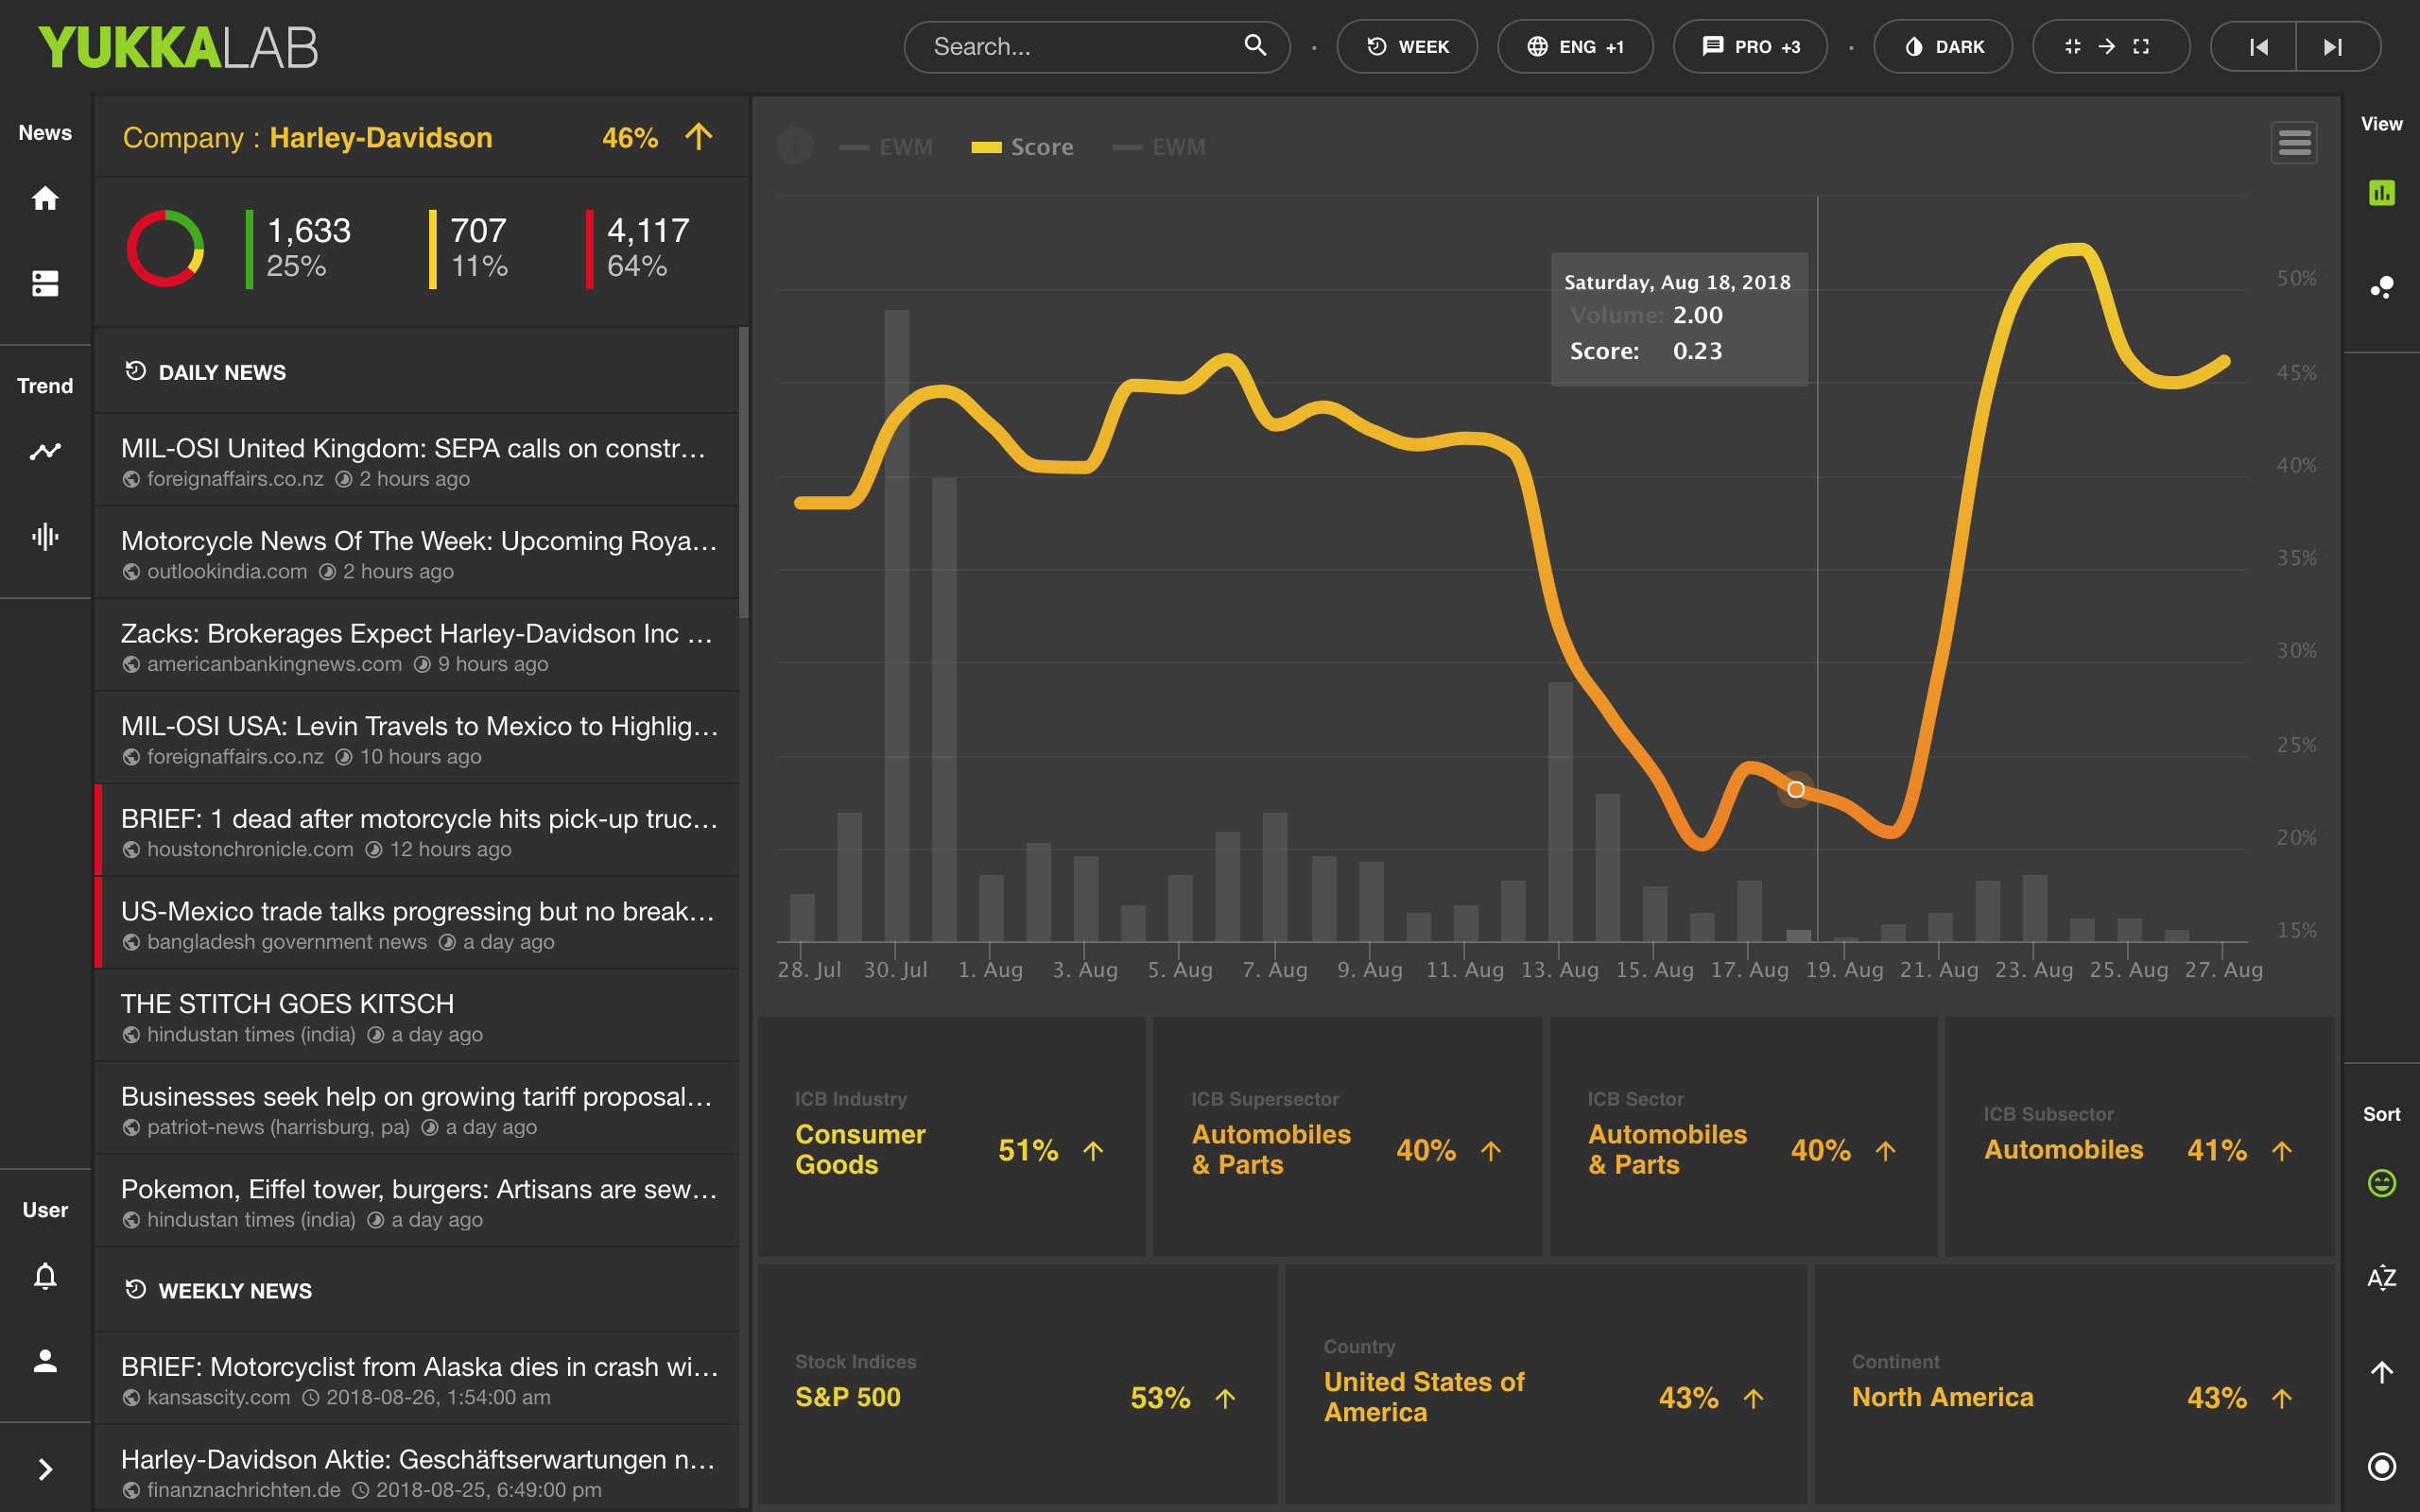
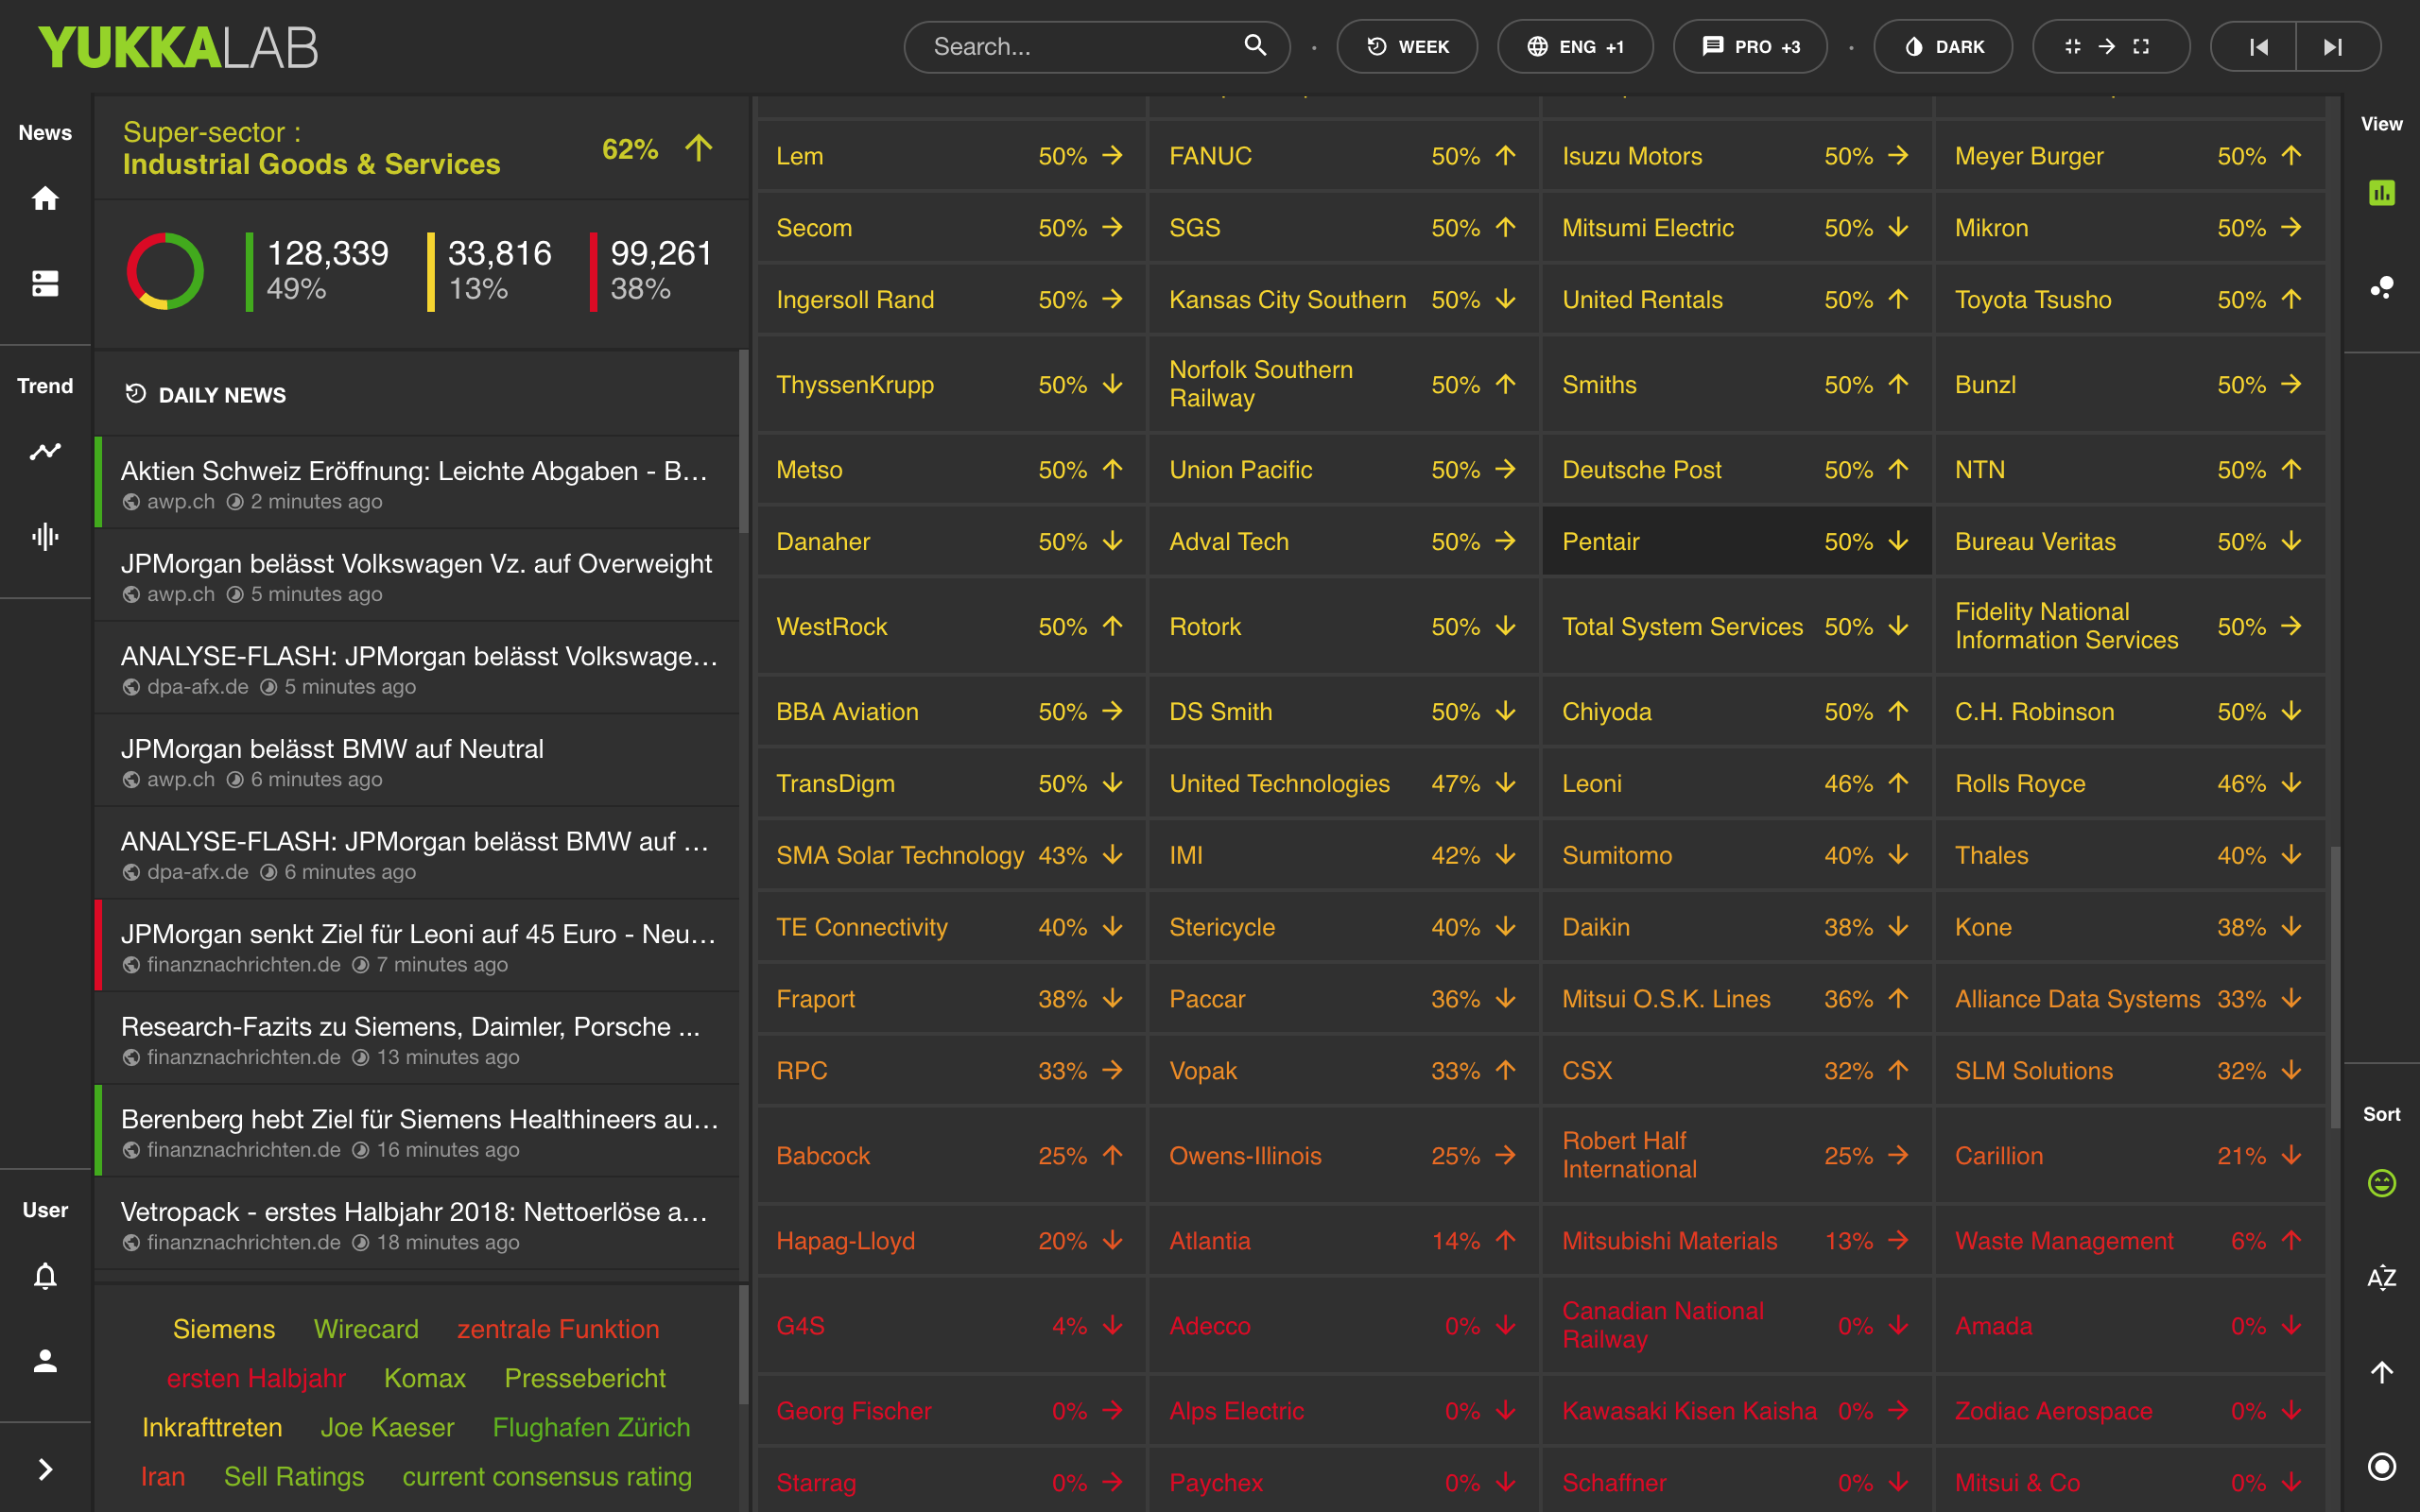
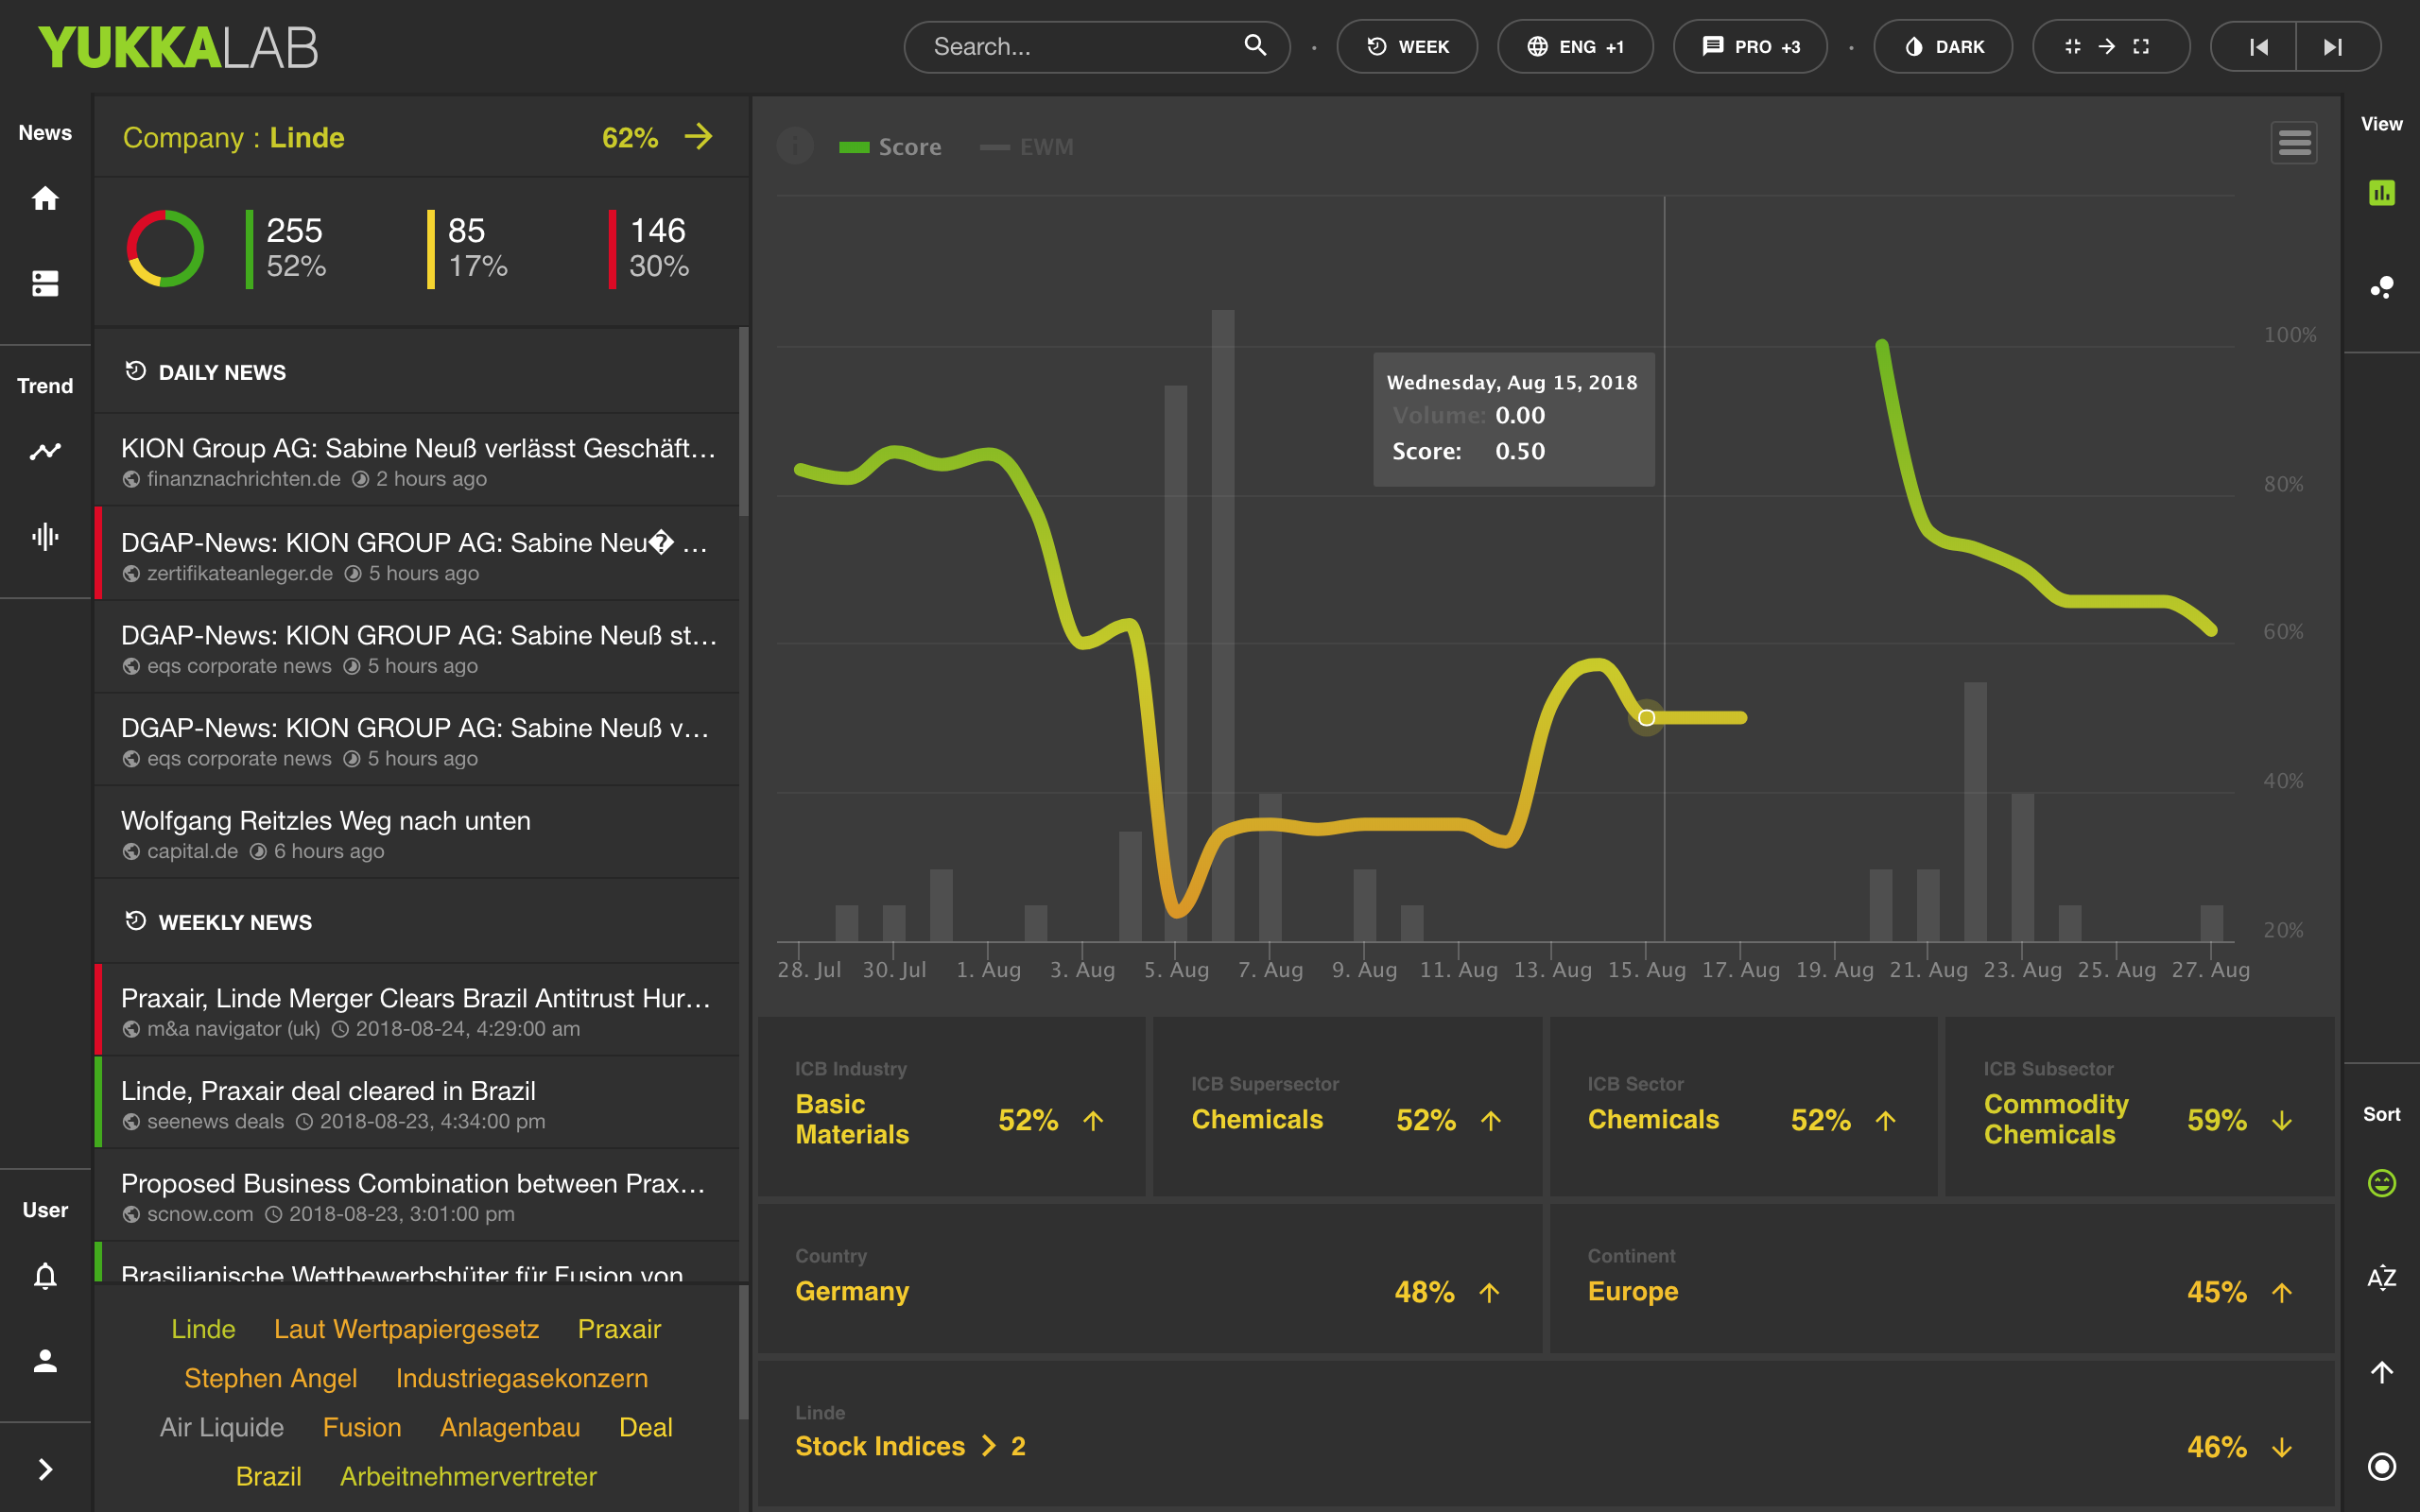
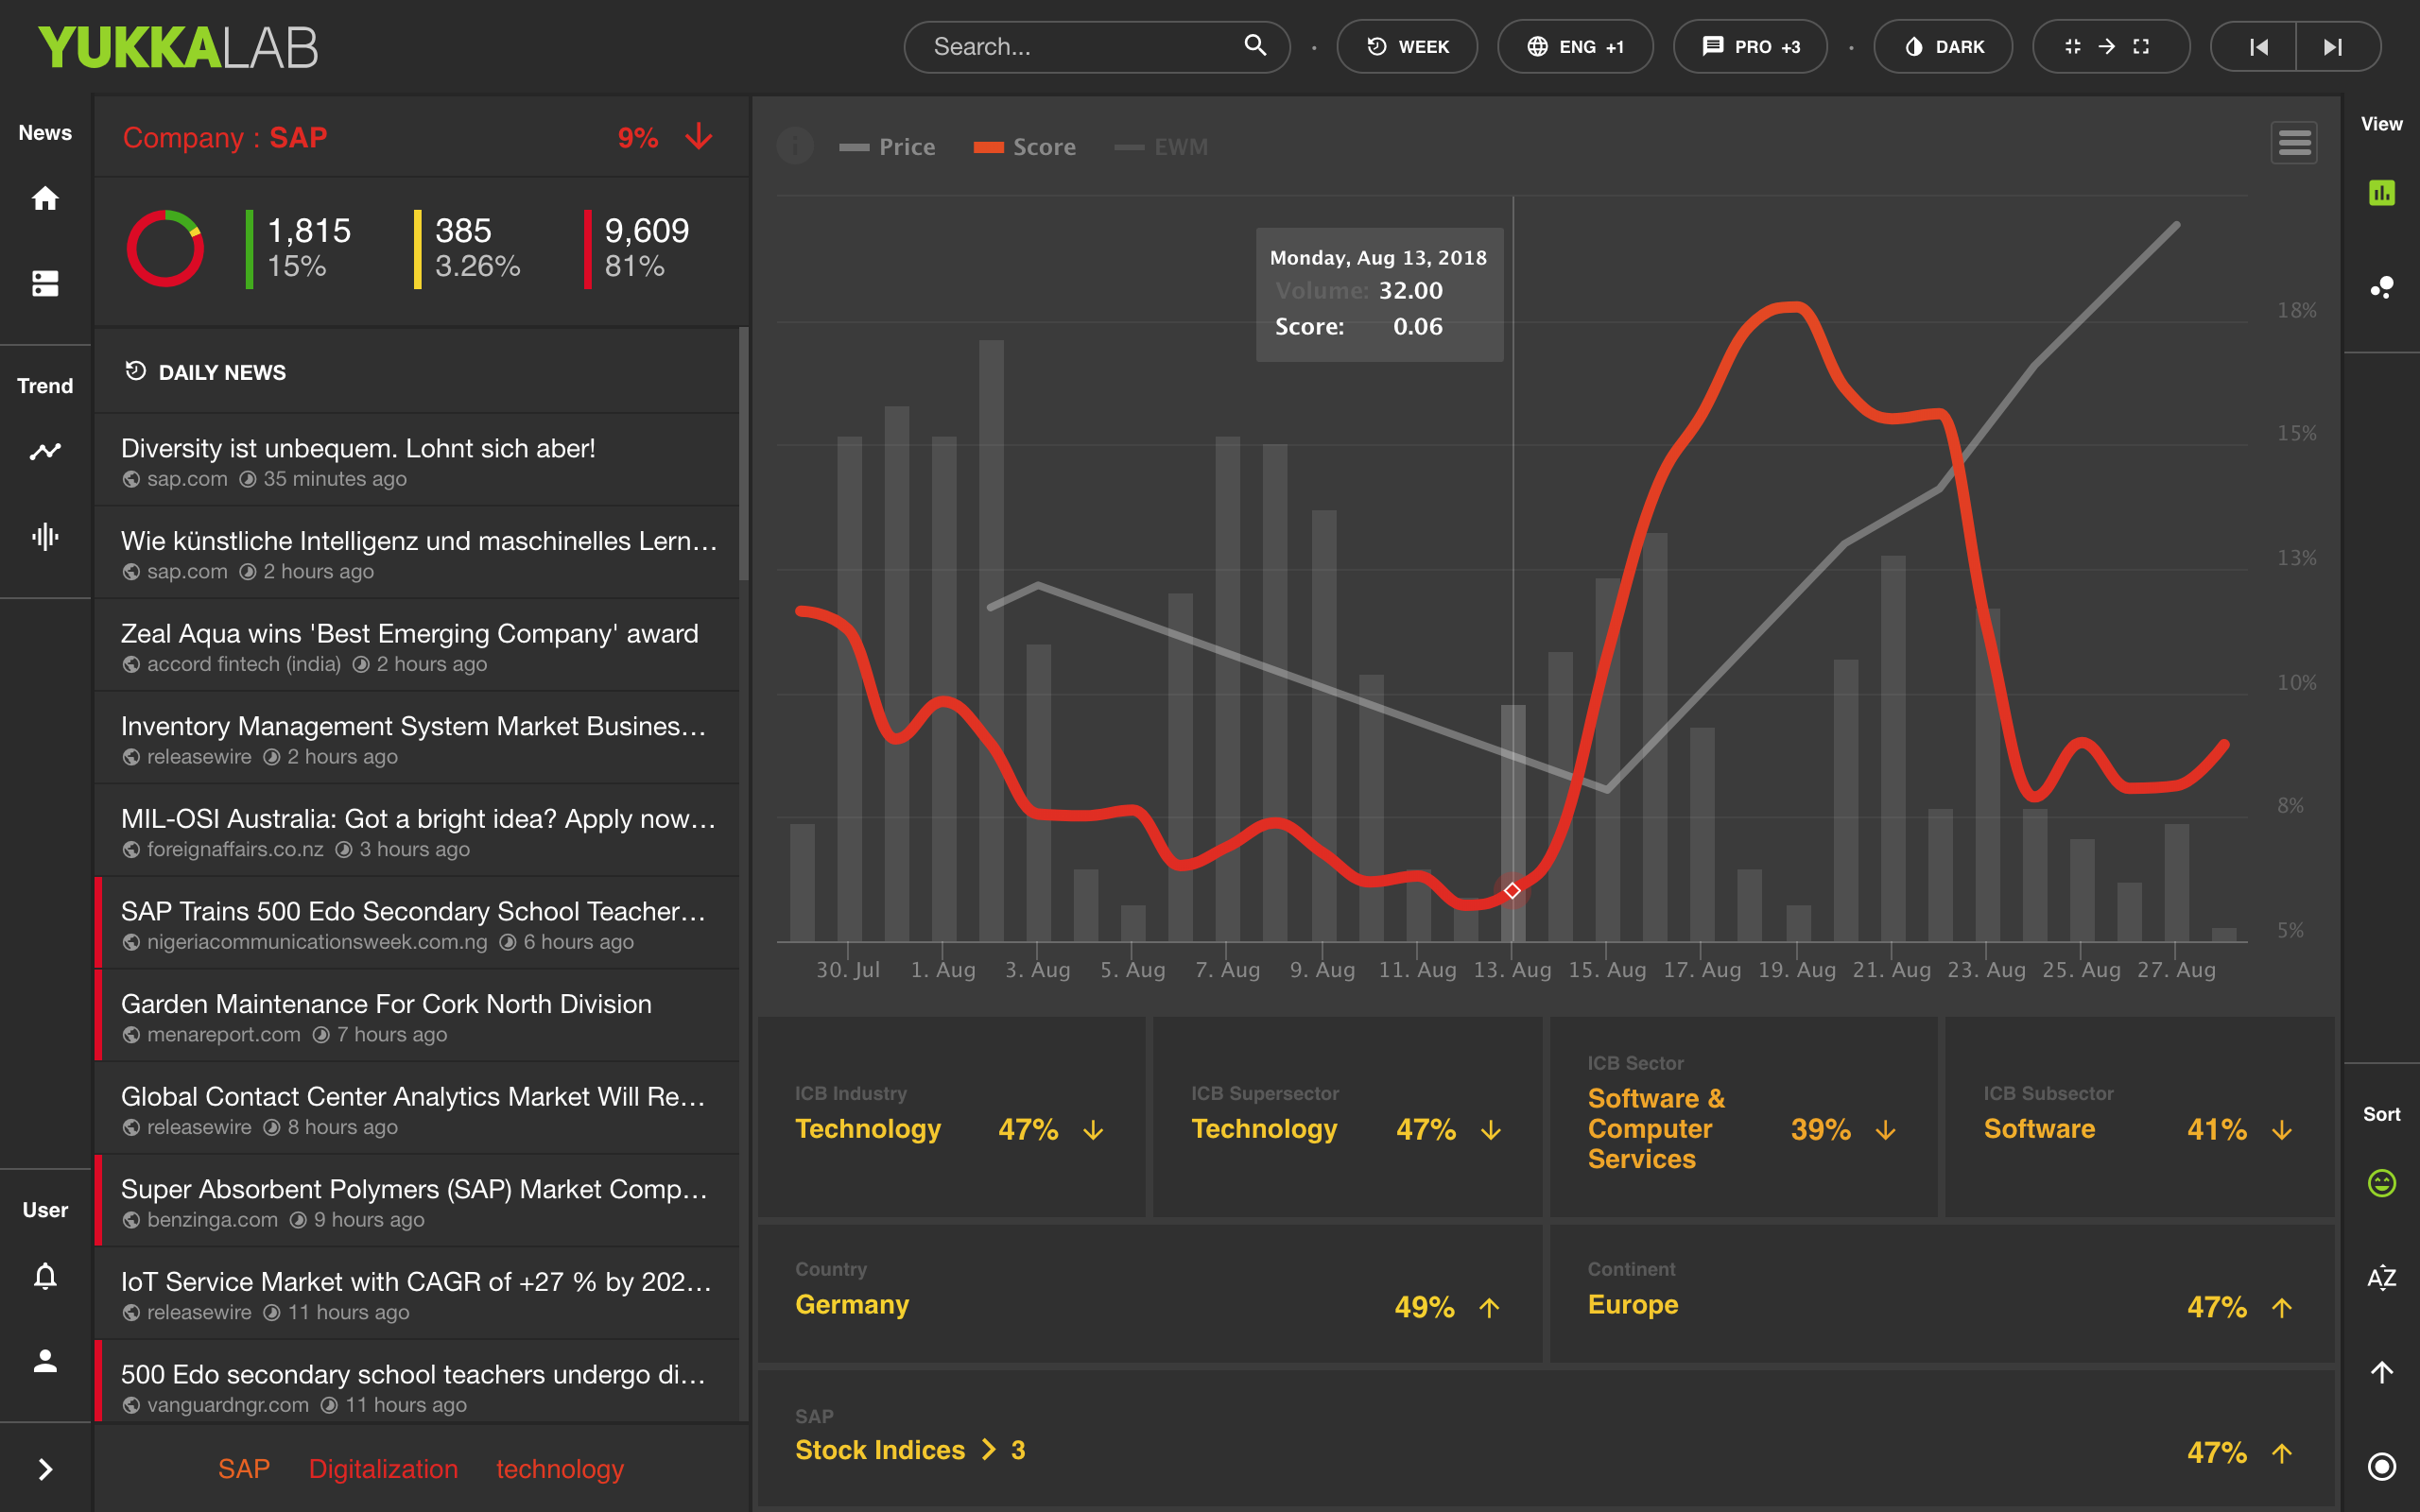
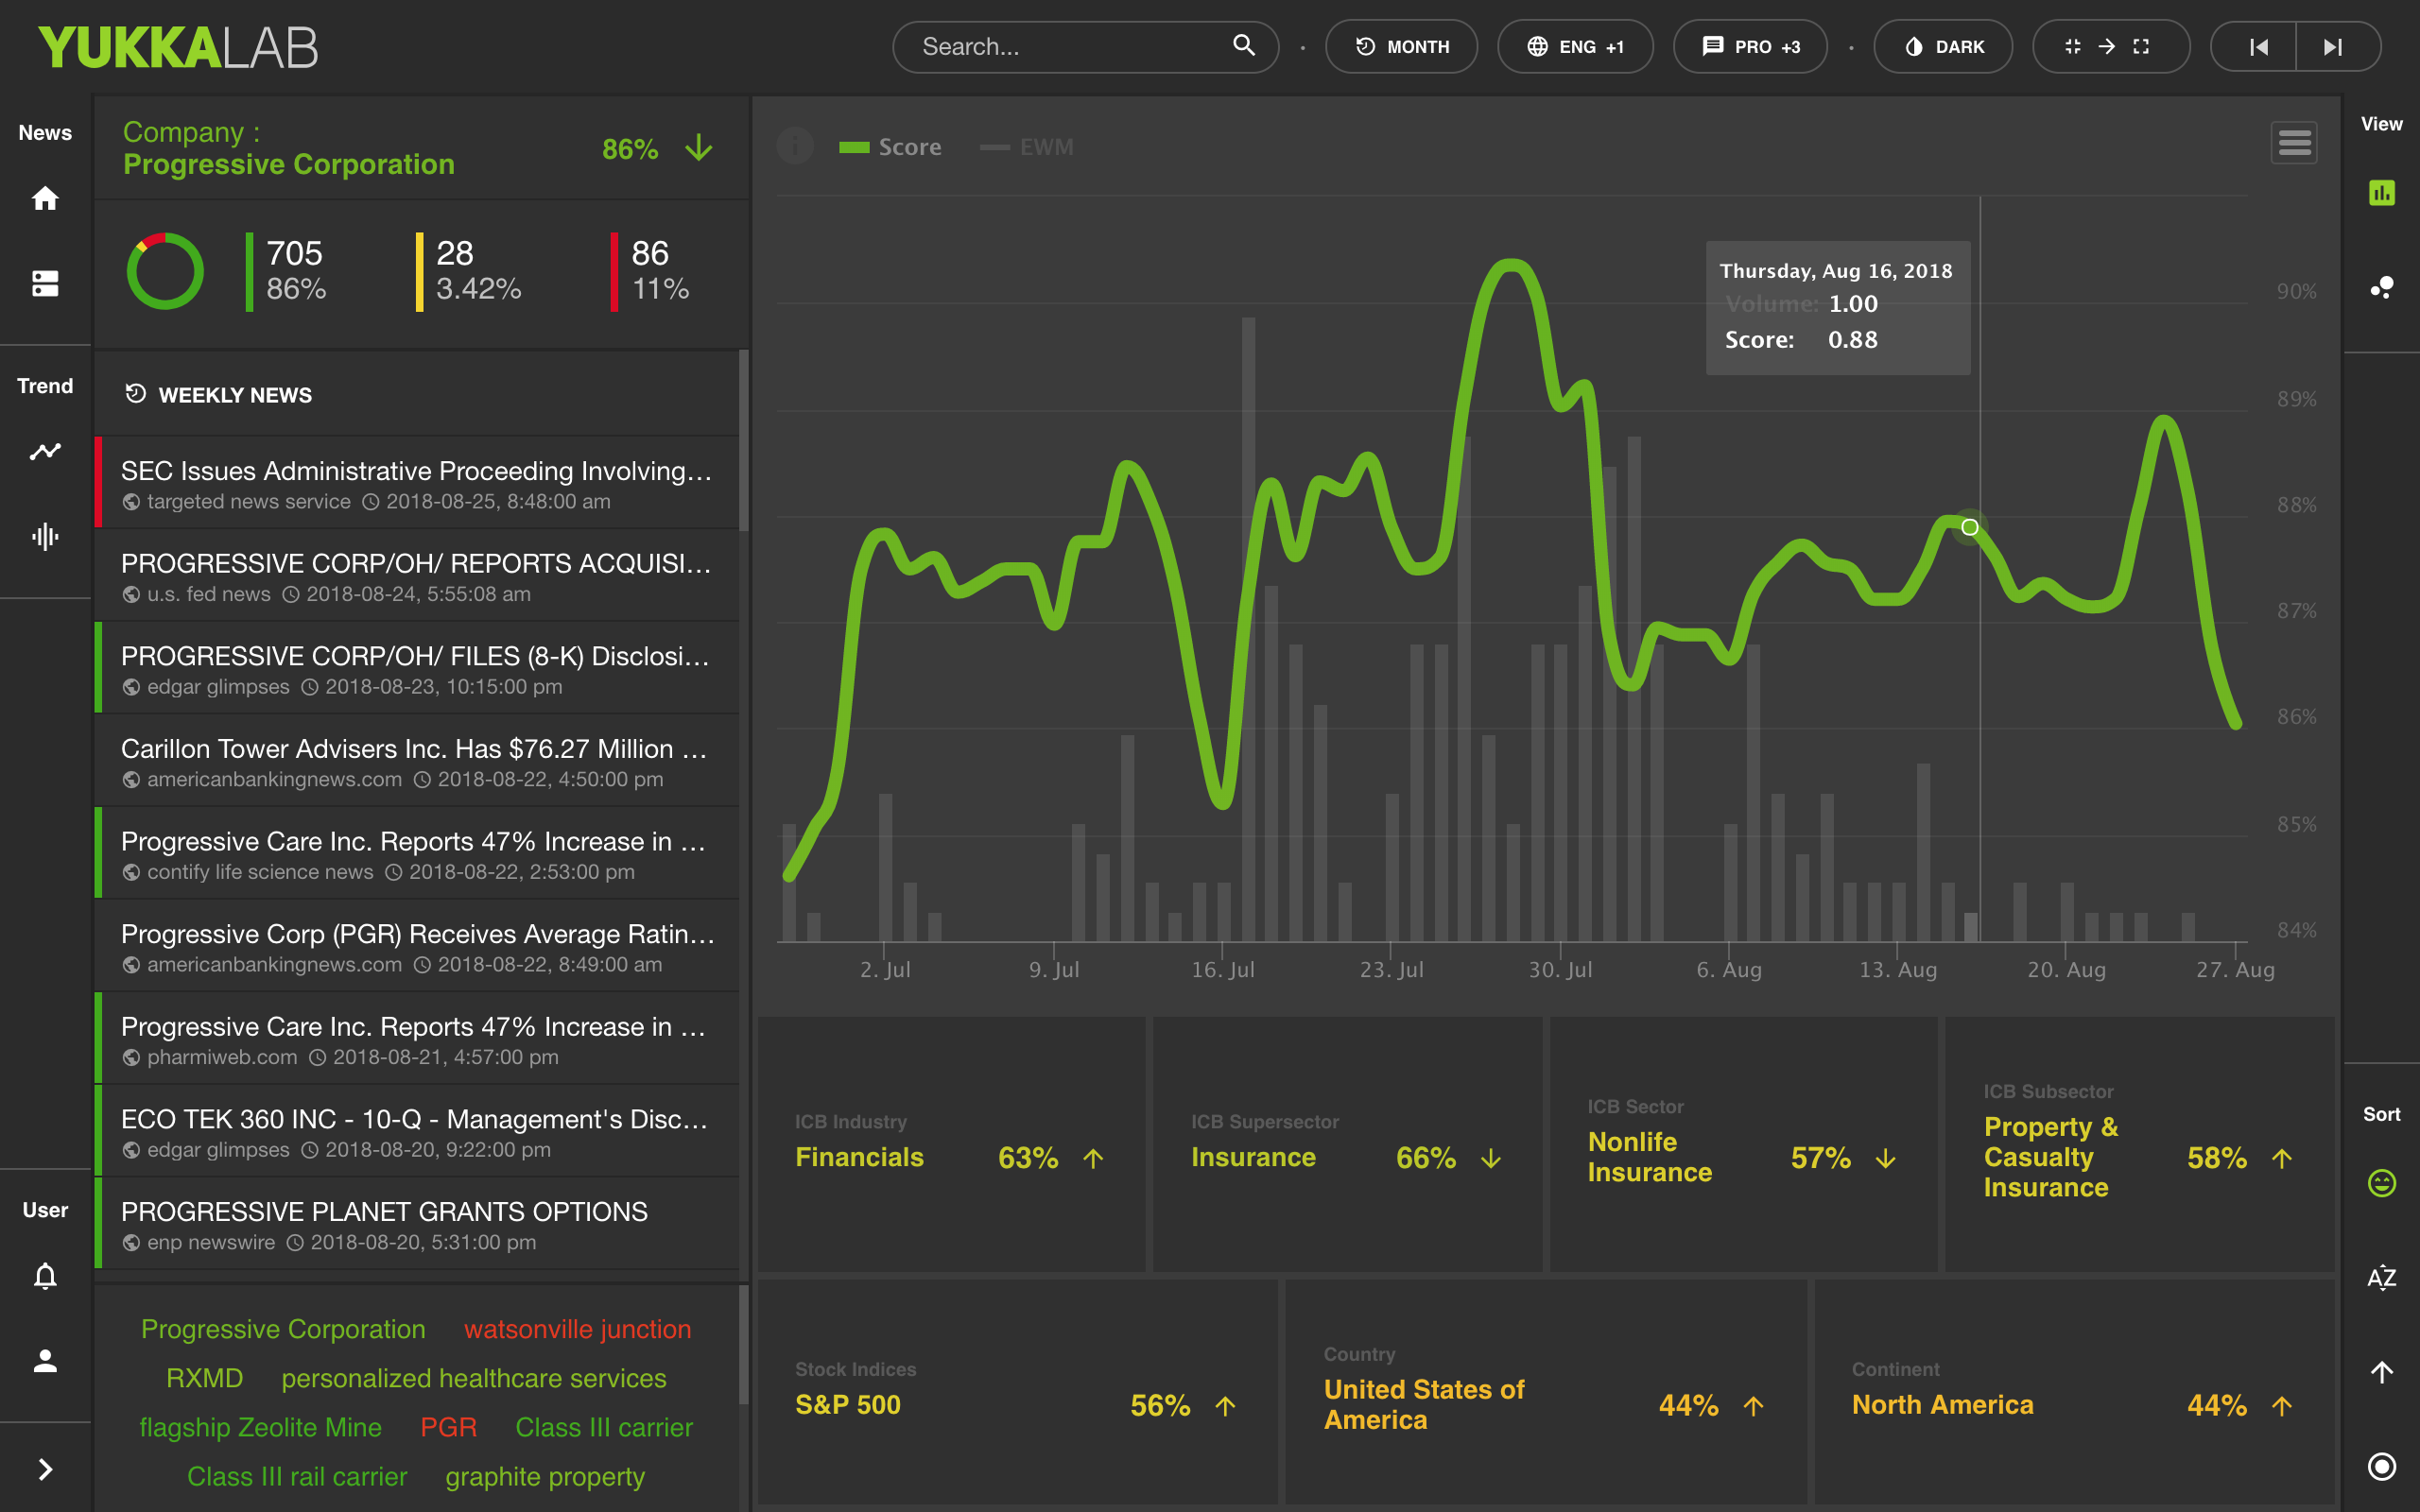
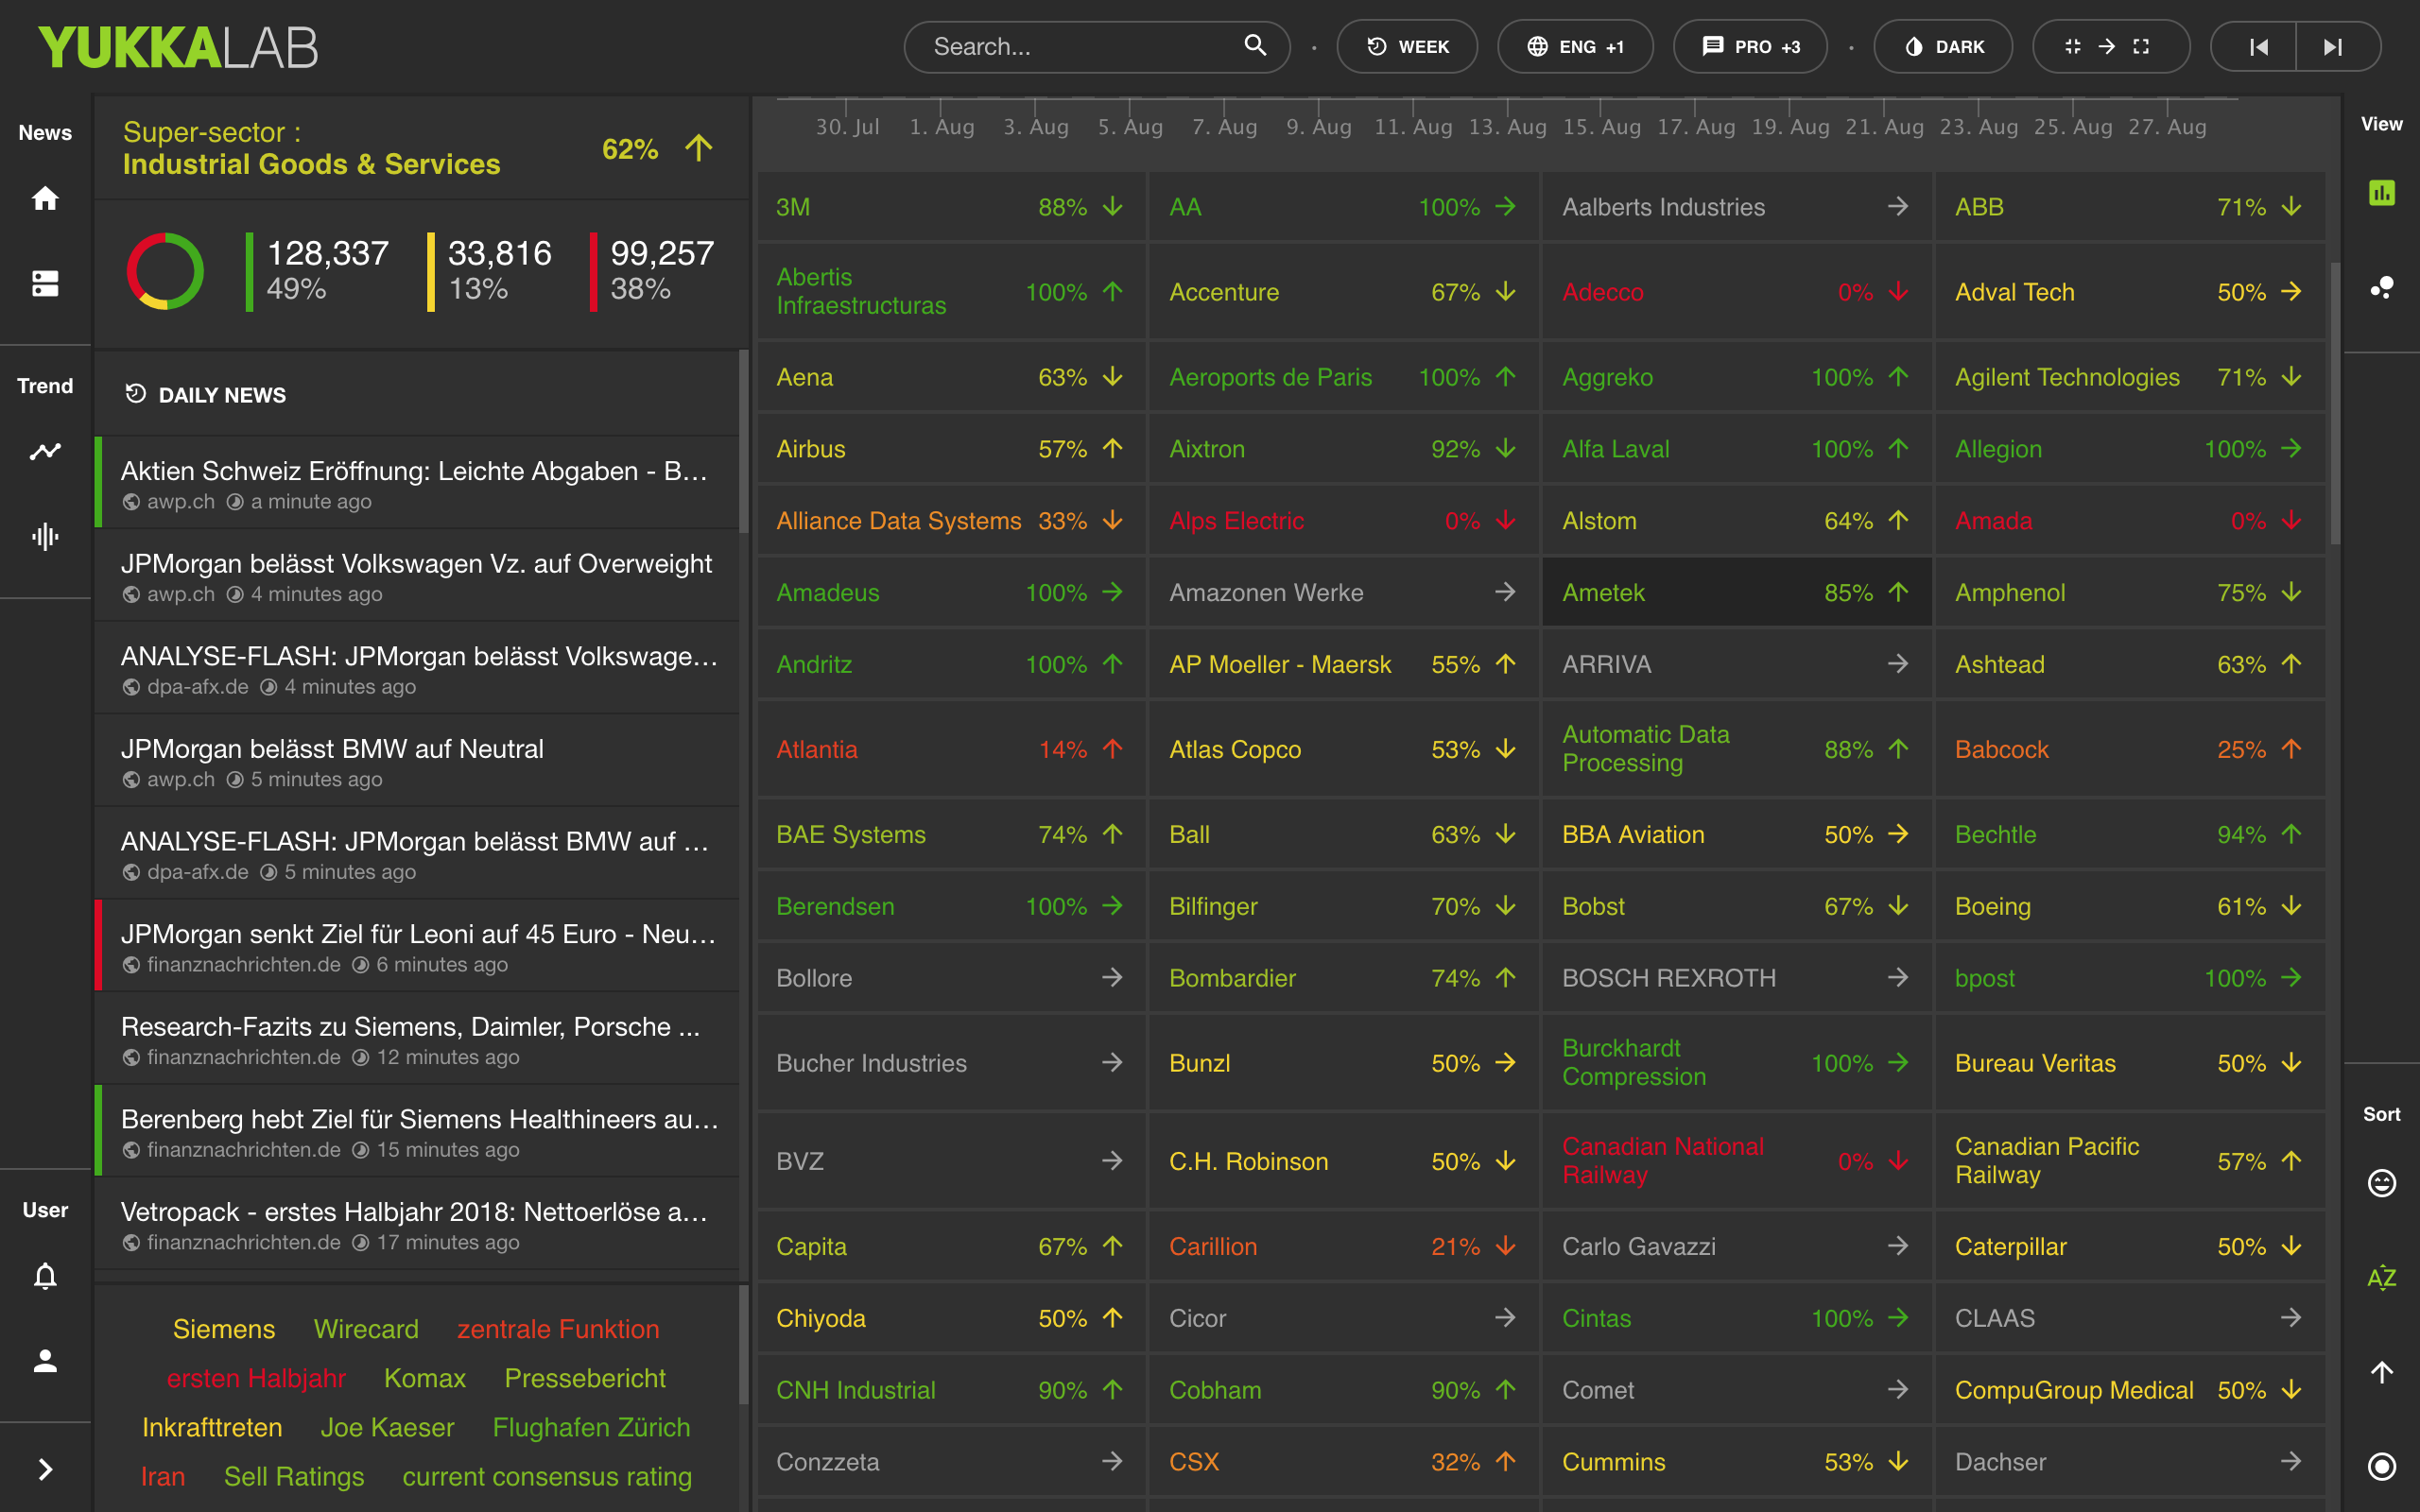
YUKKA Lab
Chartmap

Description
This project focuses on visualizing sentiment analysis using Angular and Material Design.
Key Components:
- Sentiment Chart:
- Technology: Highcharts
- Functionality: Displays the numerical value of sentiment in a graphical format.
- News Feed (Left Side):
- Organization: List of news articles sorted chronologically (by time).
- Sentiment Analysis (Right Side - Chart):
- Metric: Average sentiment
- Scope: Displayed over a user-defined date range.
- Comparative Analysis (Bottom):
- Purpose: Allows comparison of sentiment trends with other related stocks or companies.
Technology Stack:
- Frontend Framework: Angular
- UI Library: Material Design
- Charting Library: Highcharts
Details
Jul 2018
Gallery


