webapp
YUKKA LAb
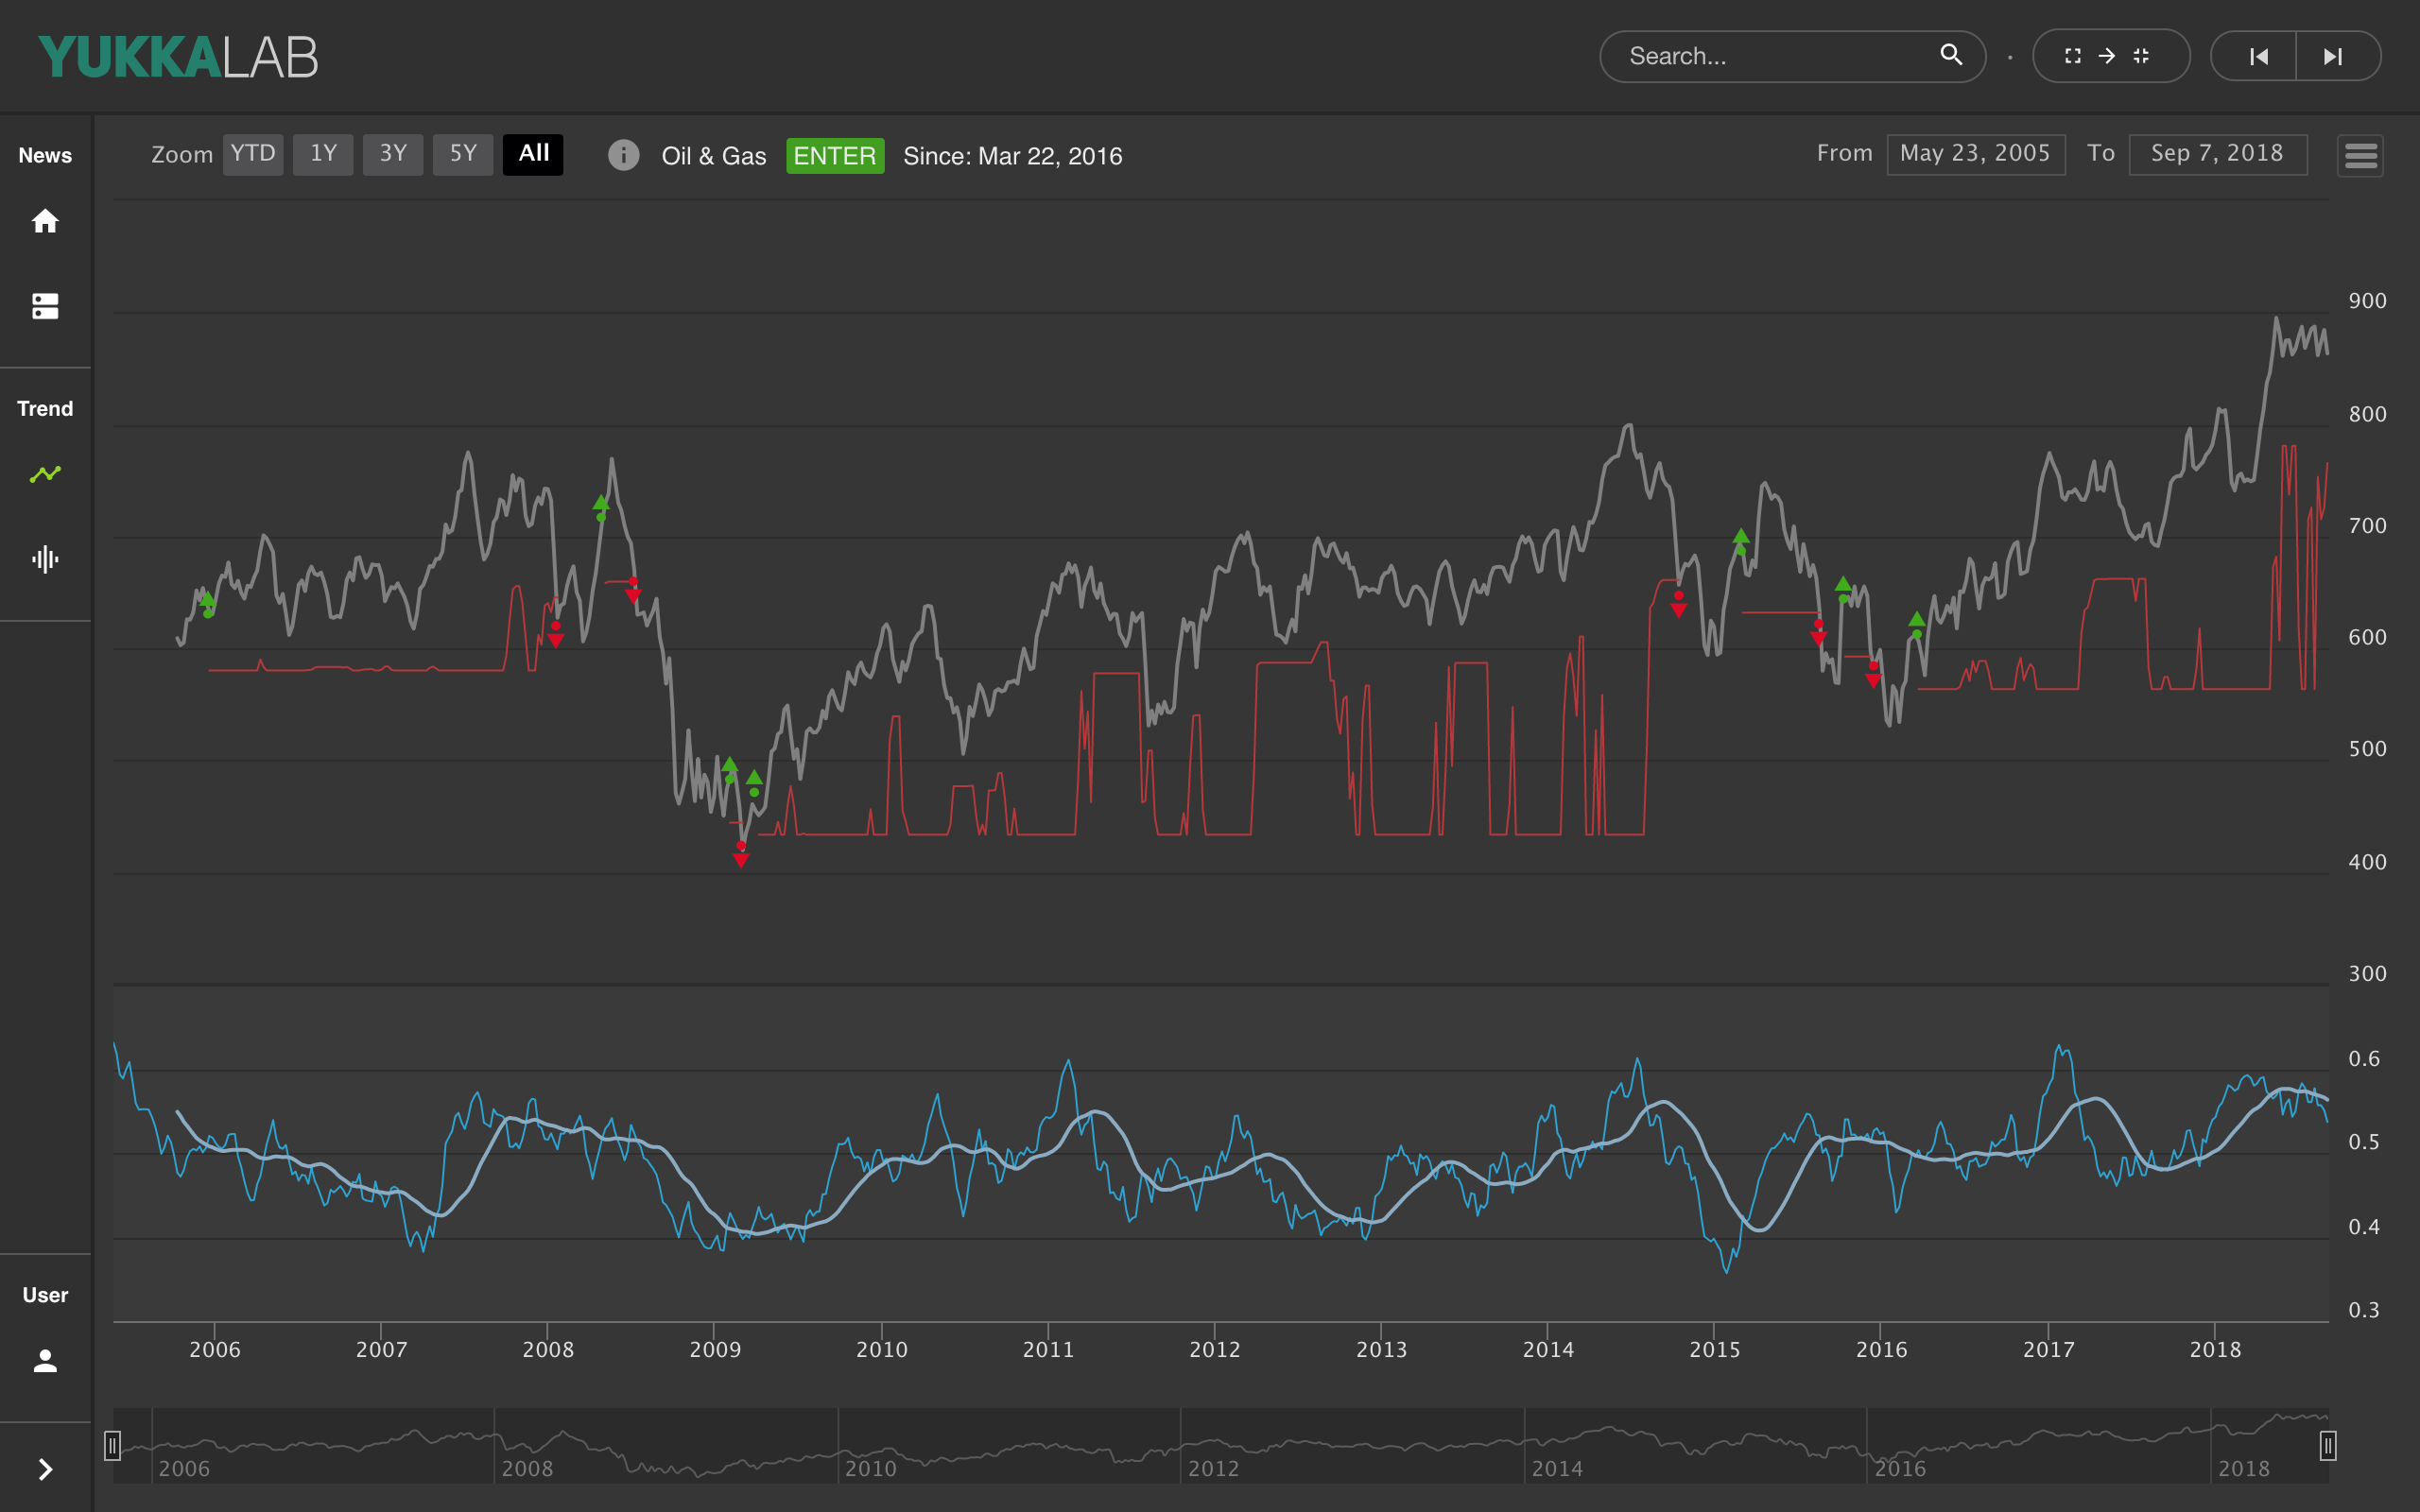
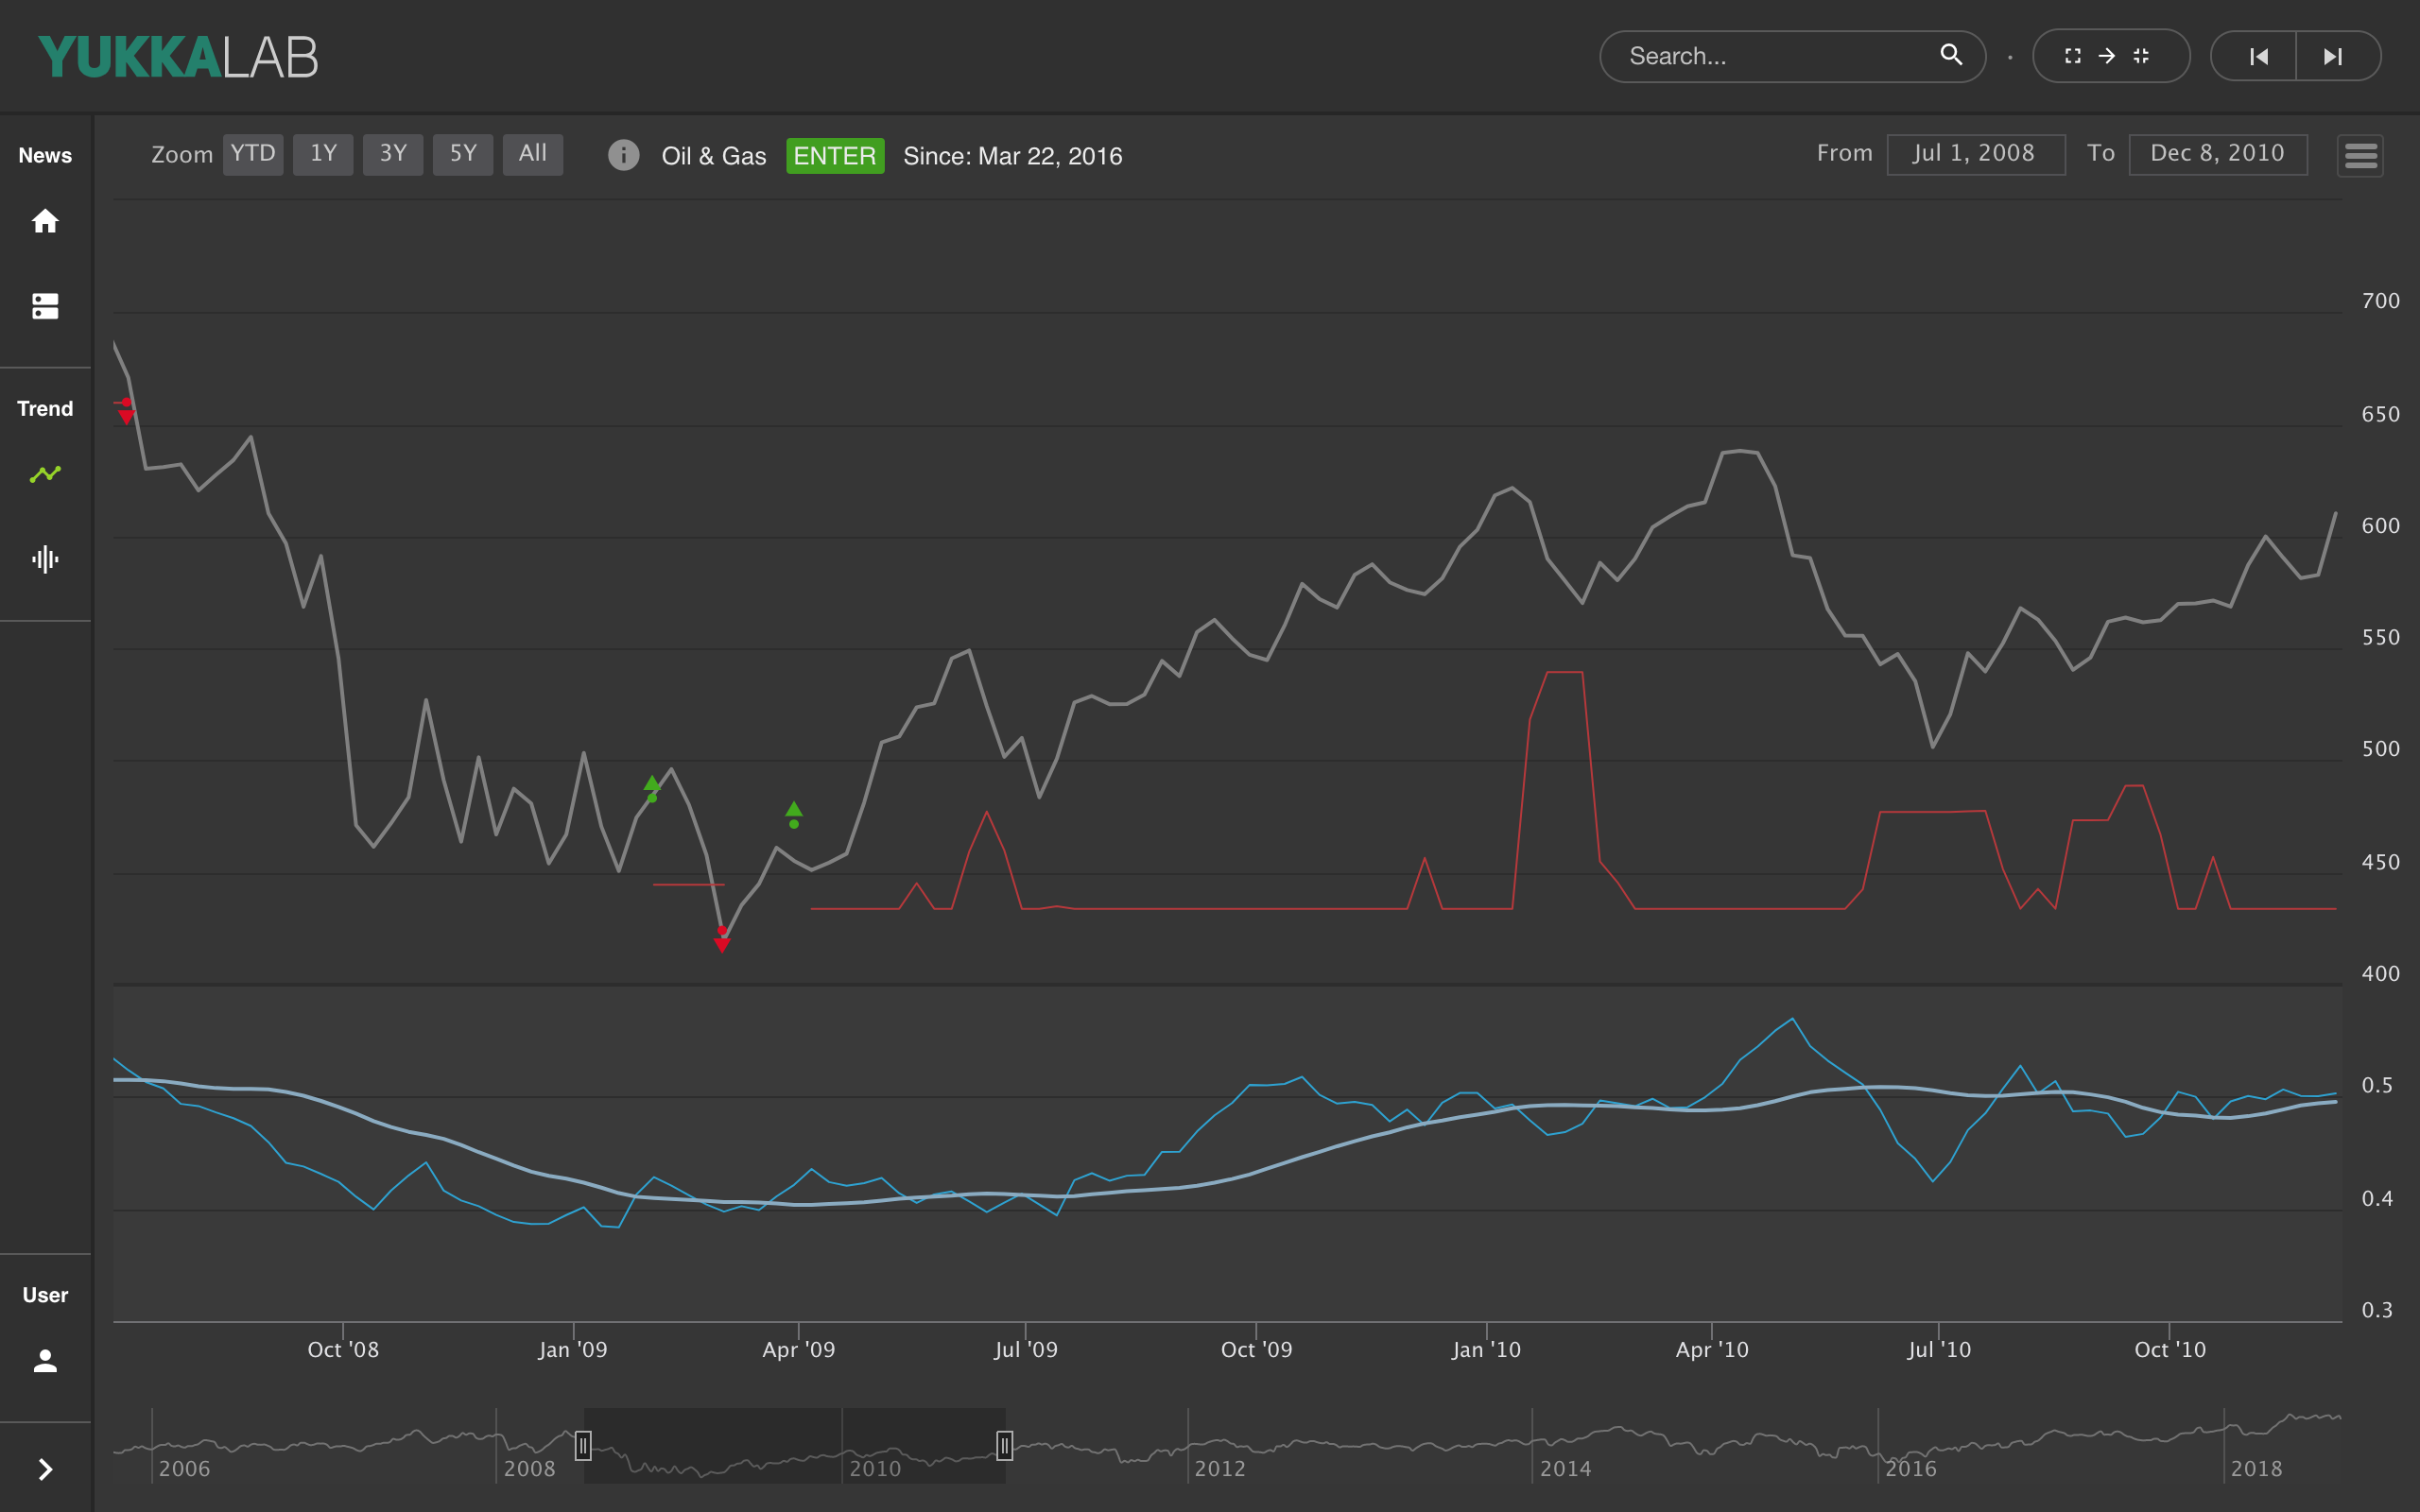
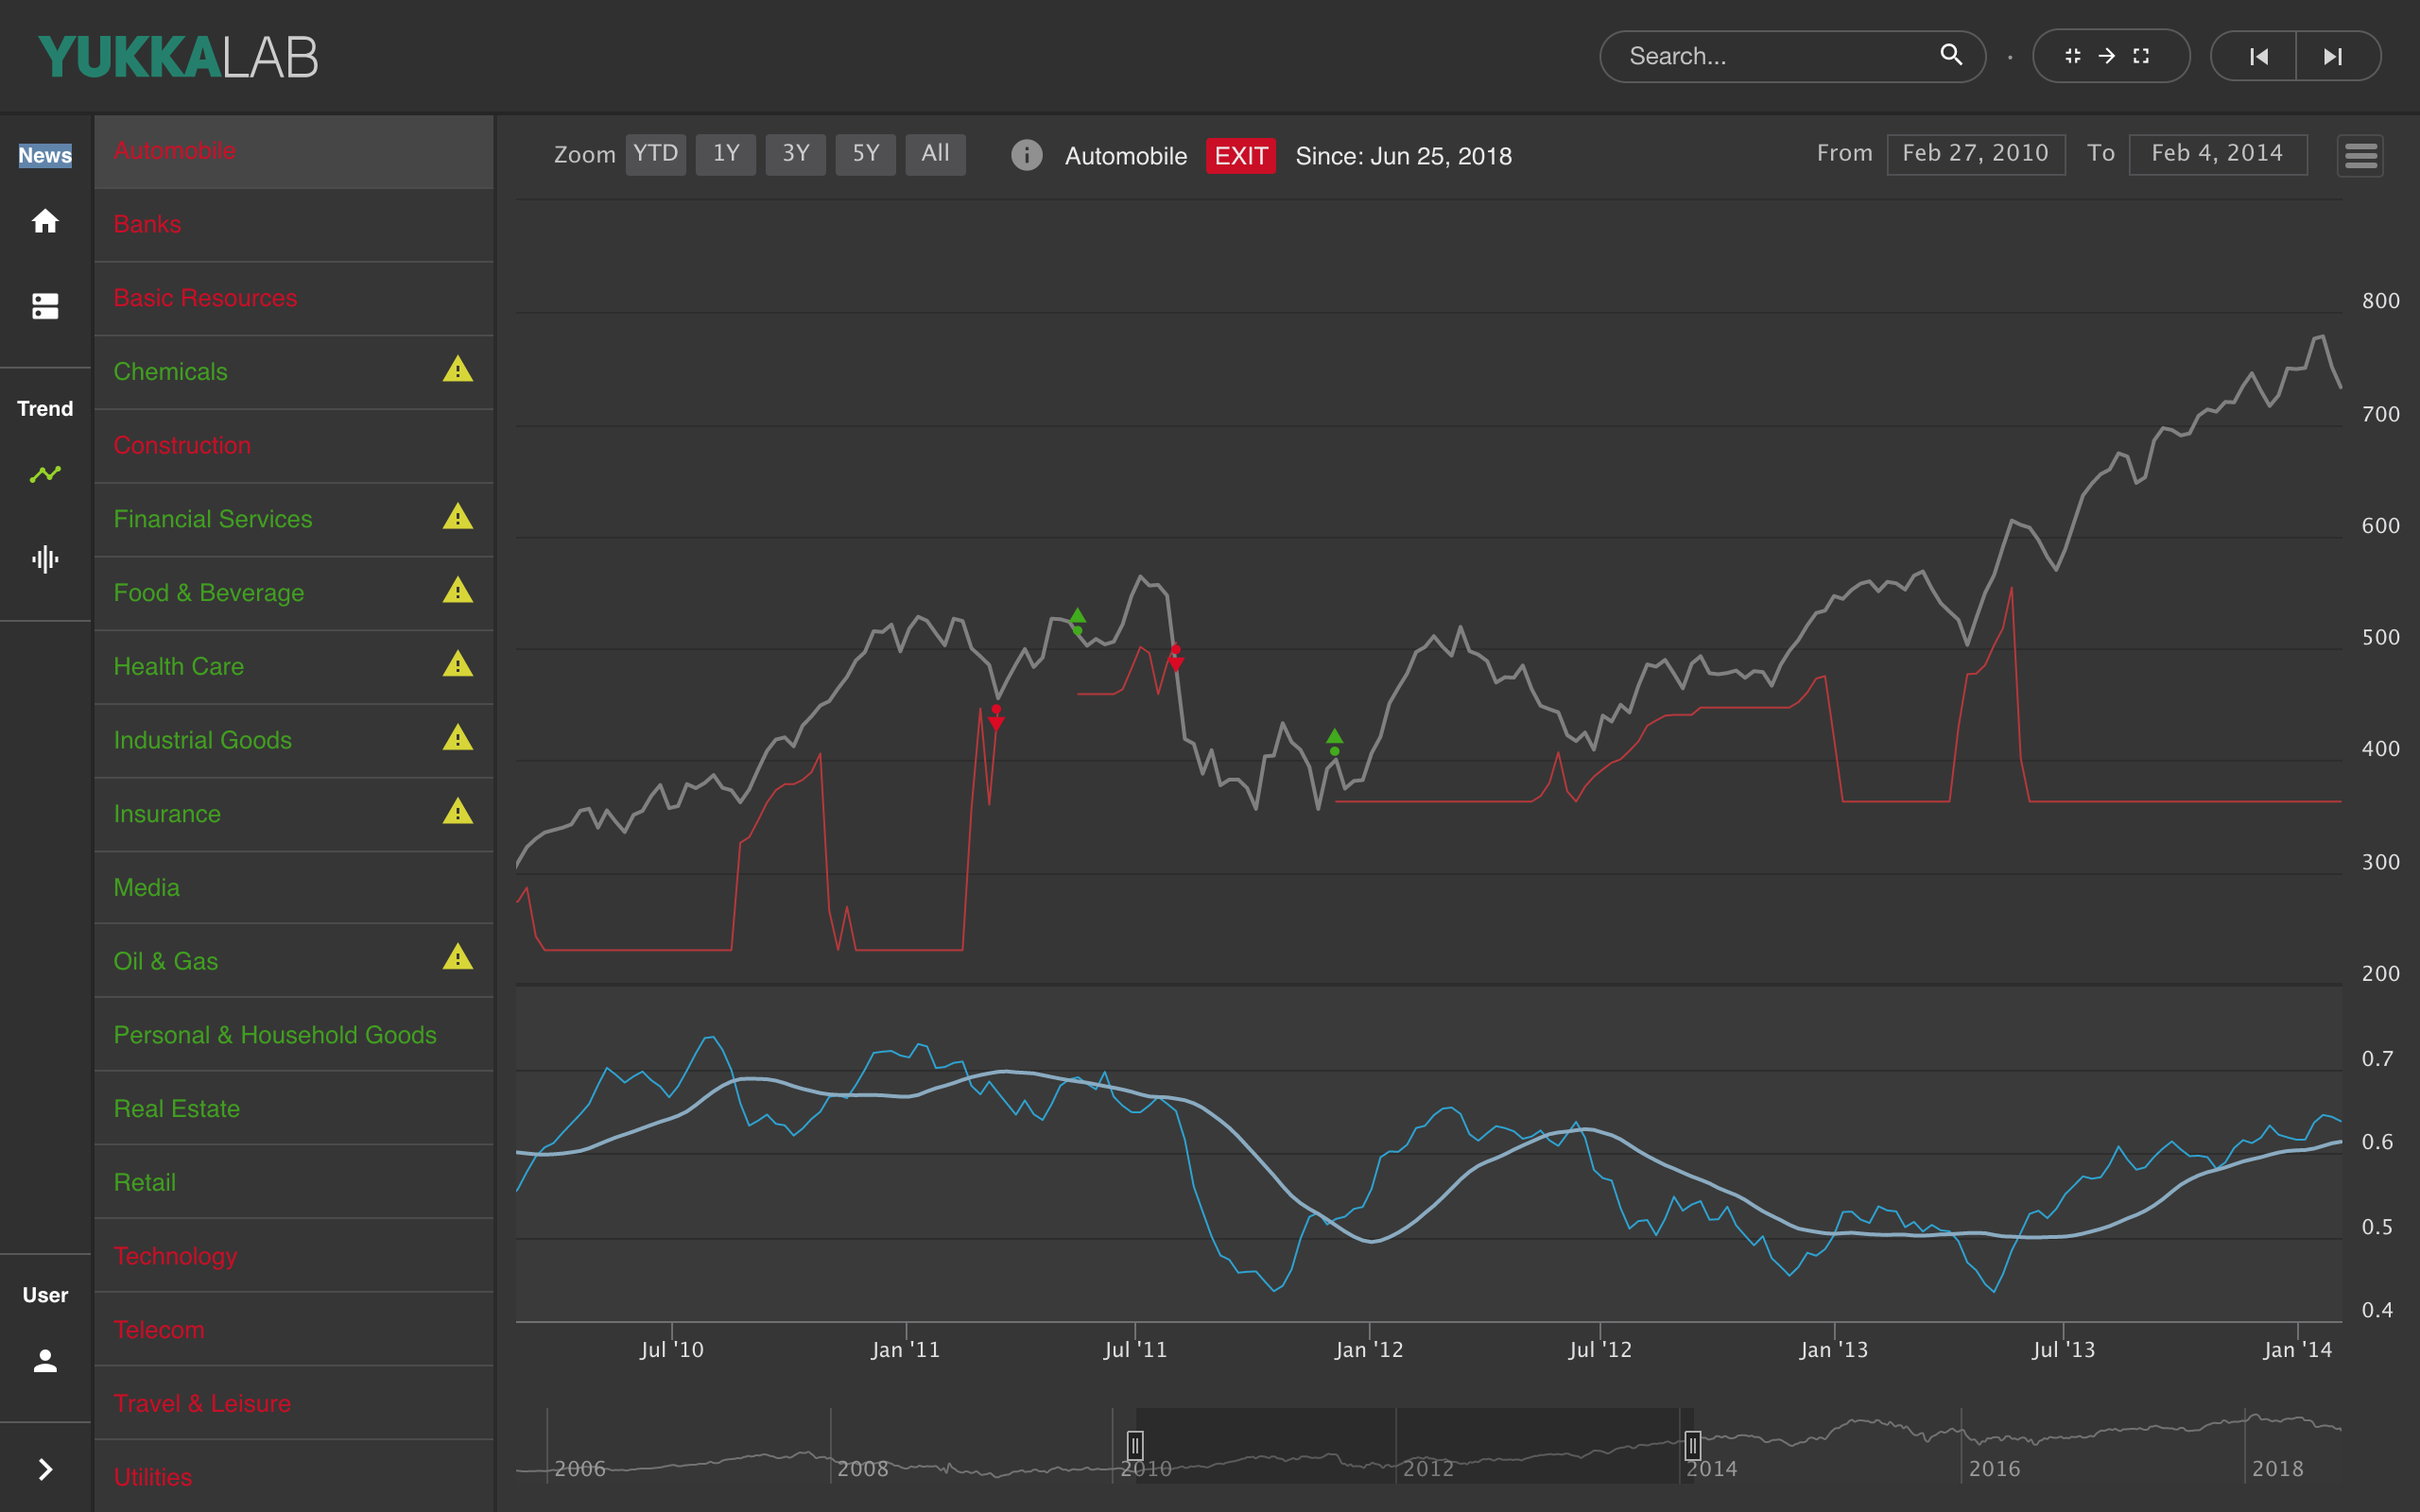
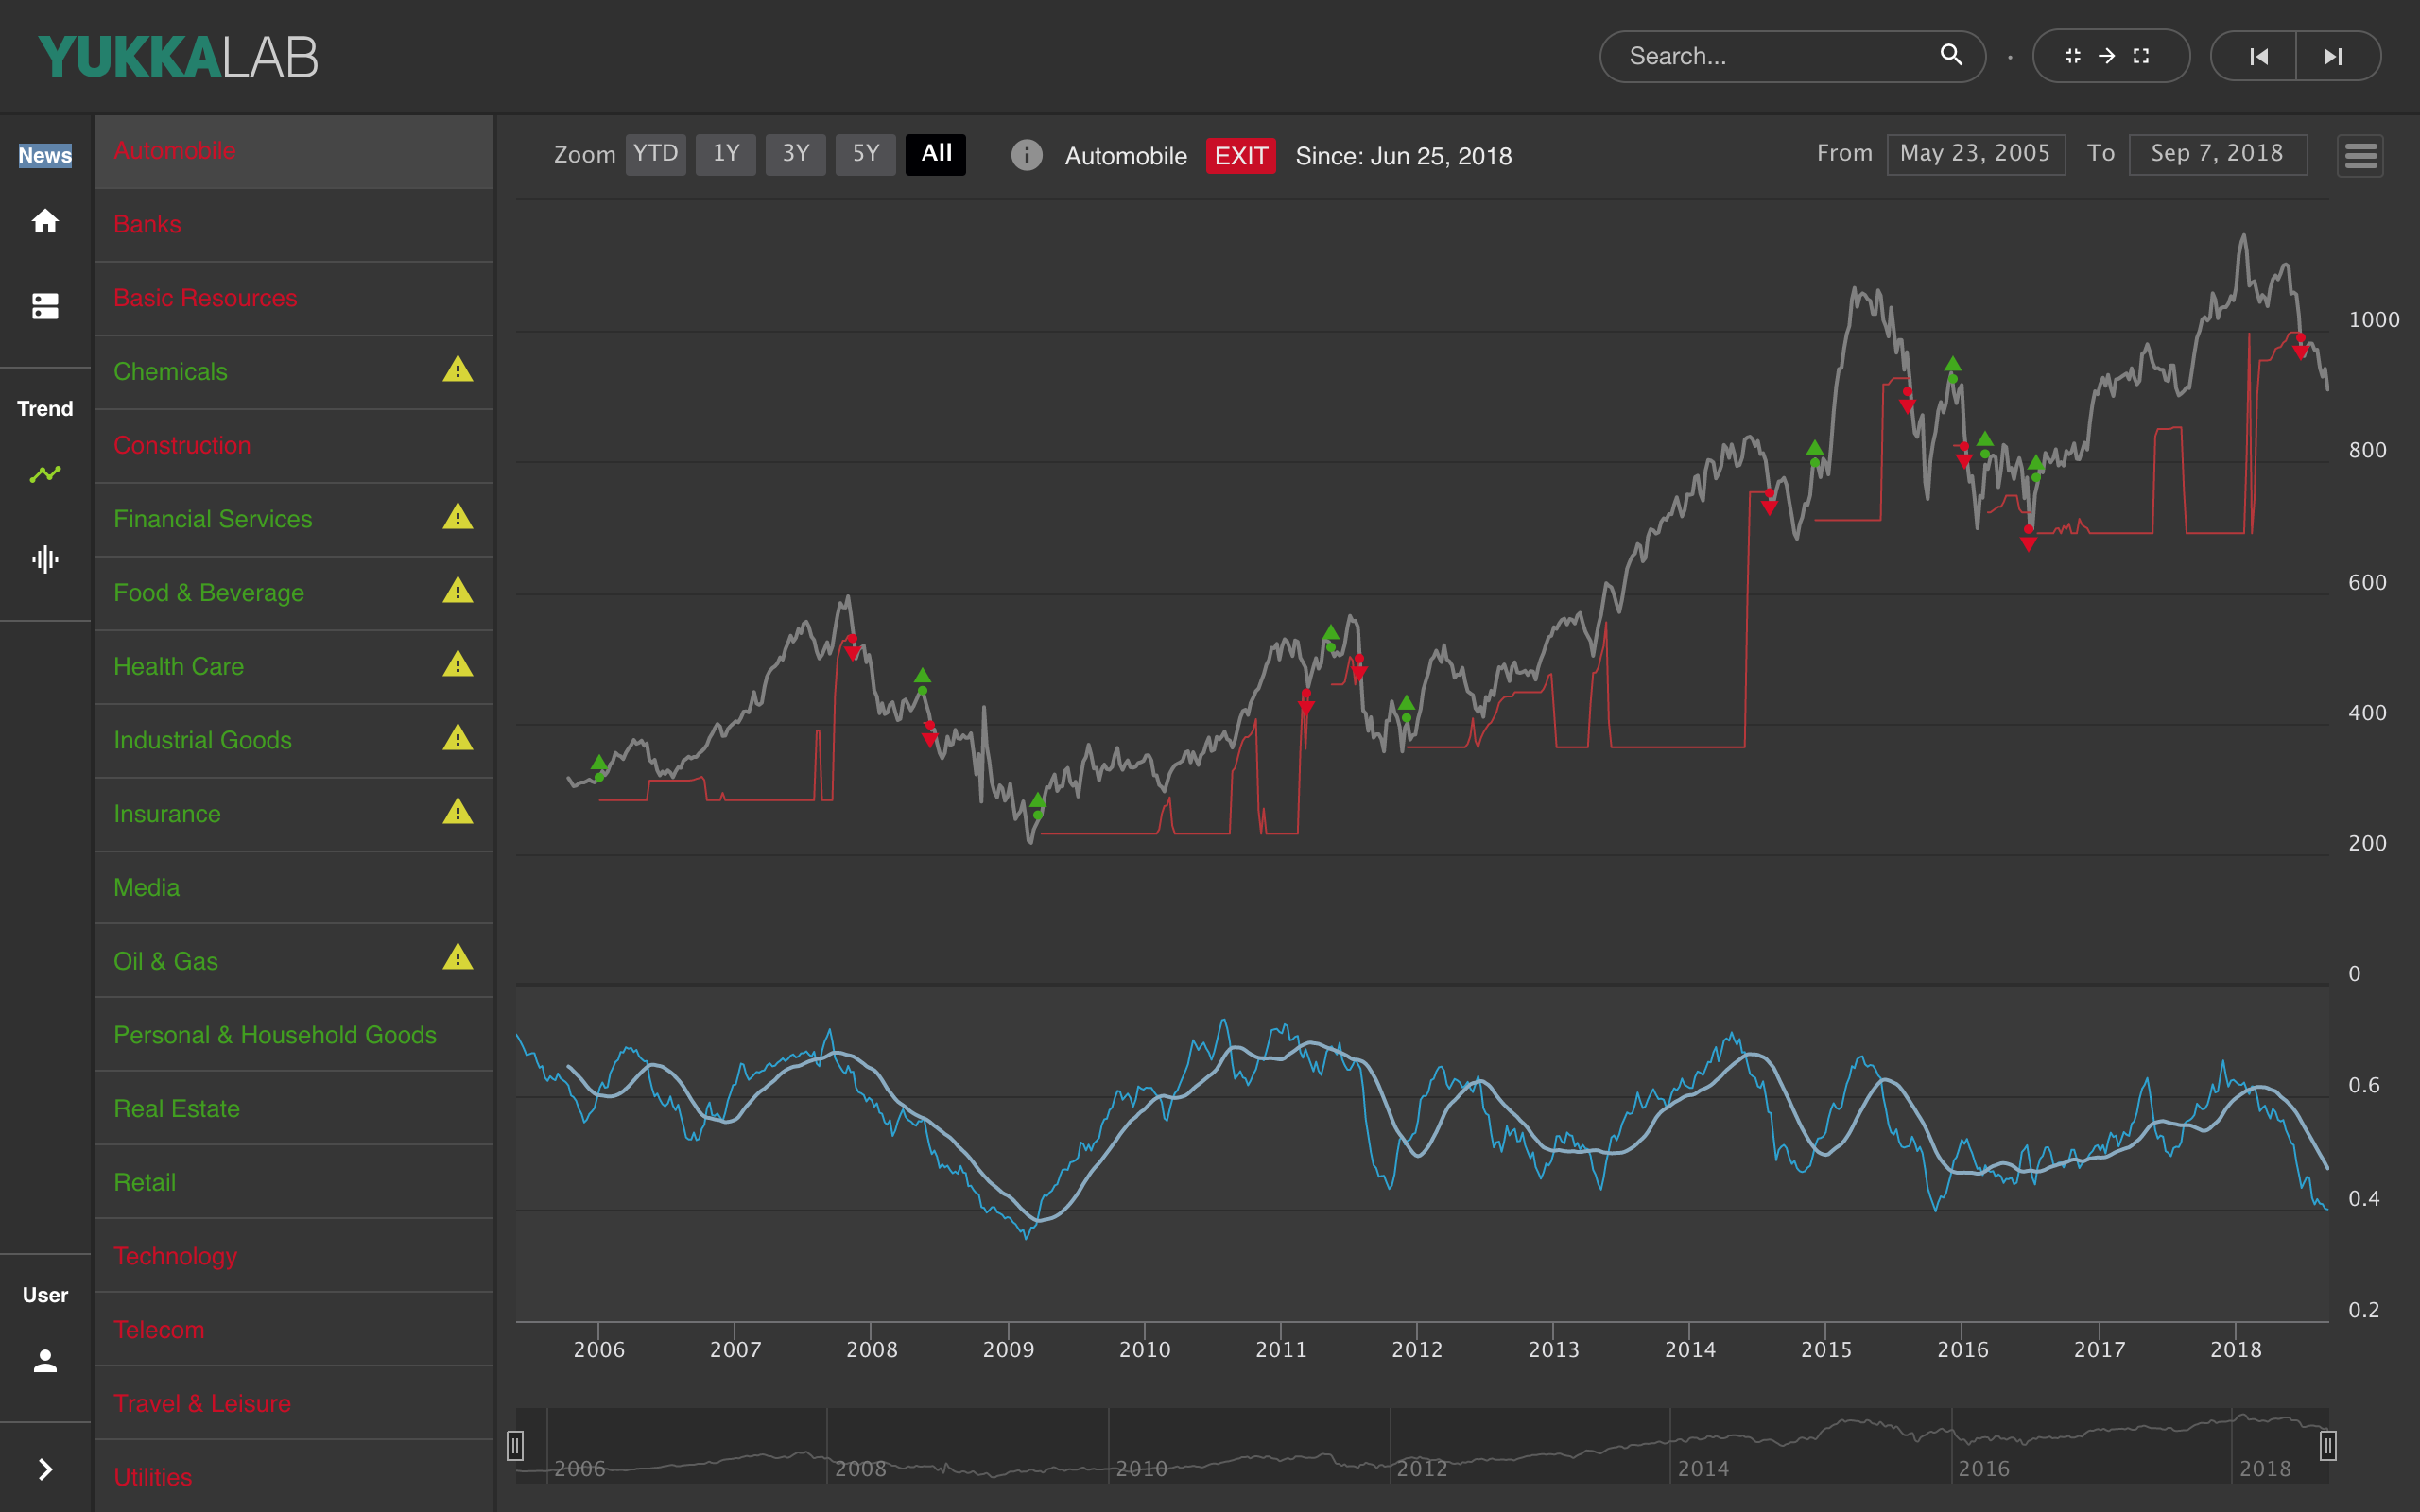
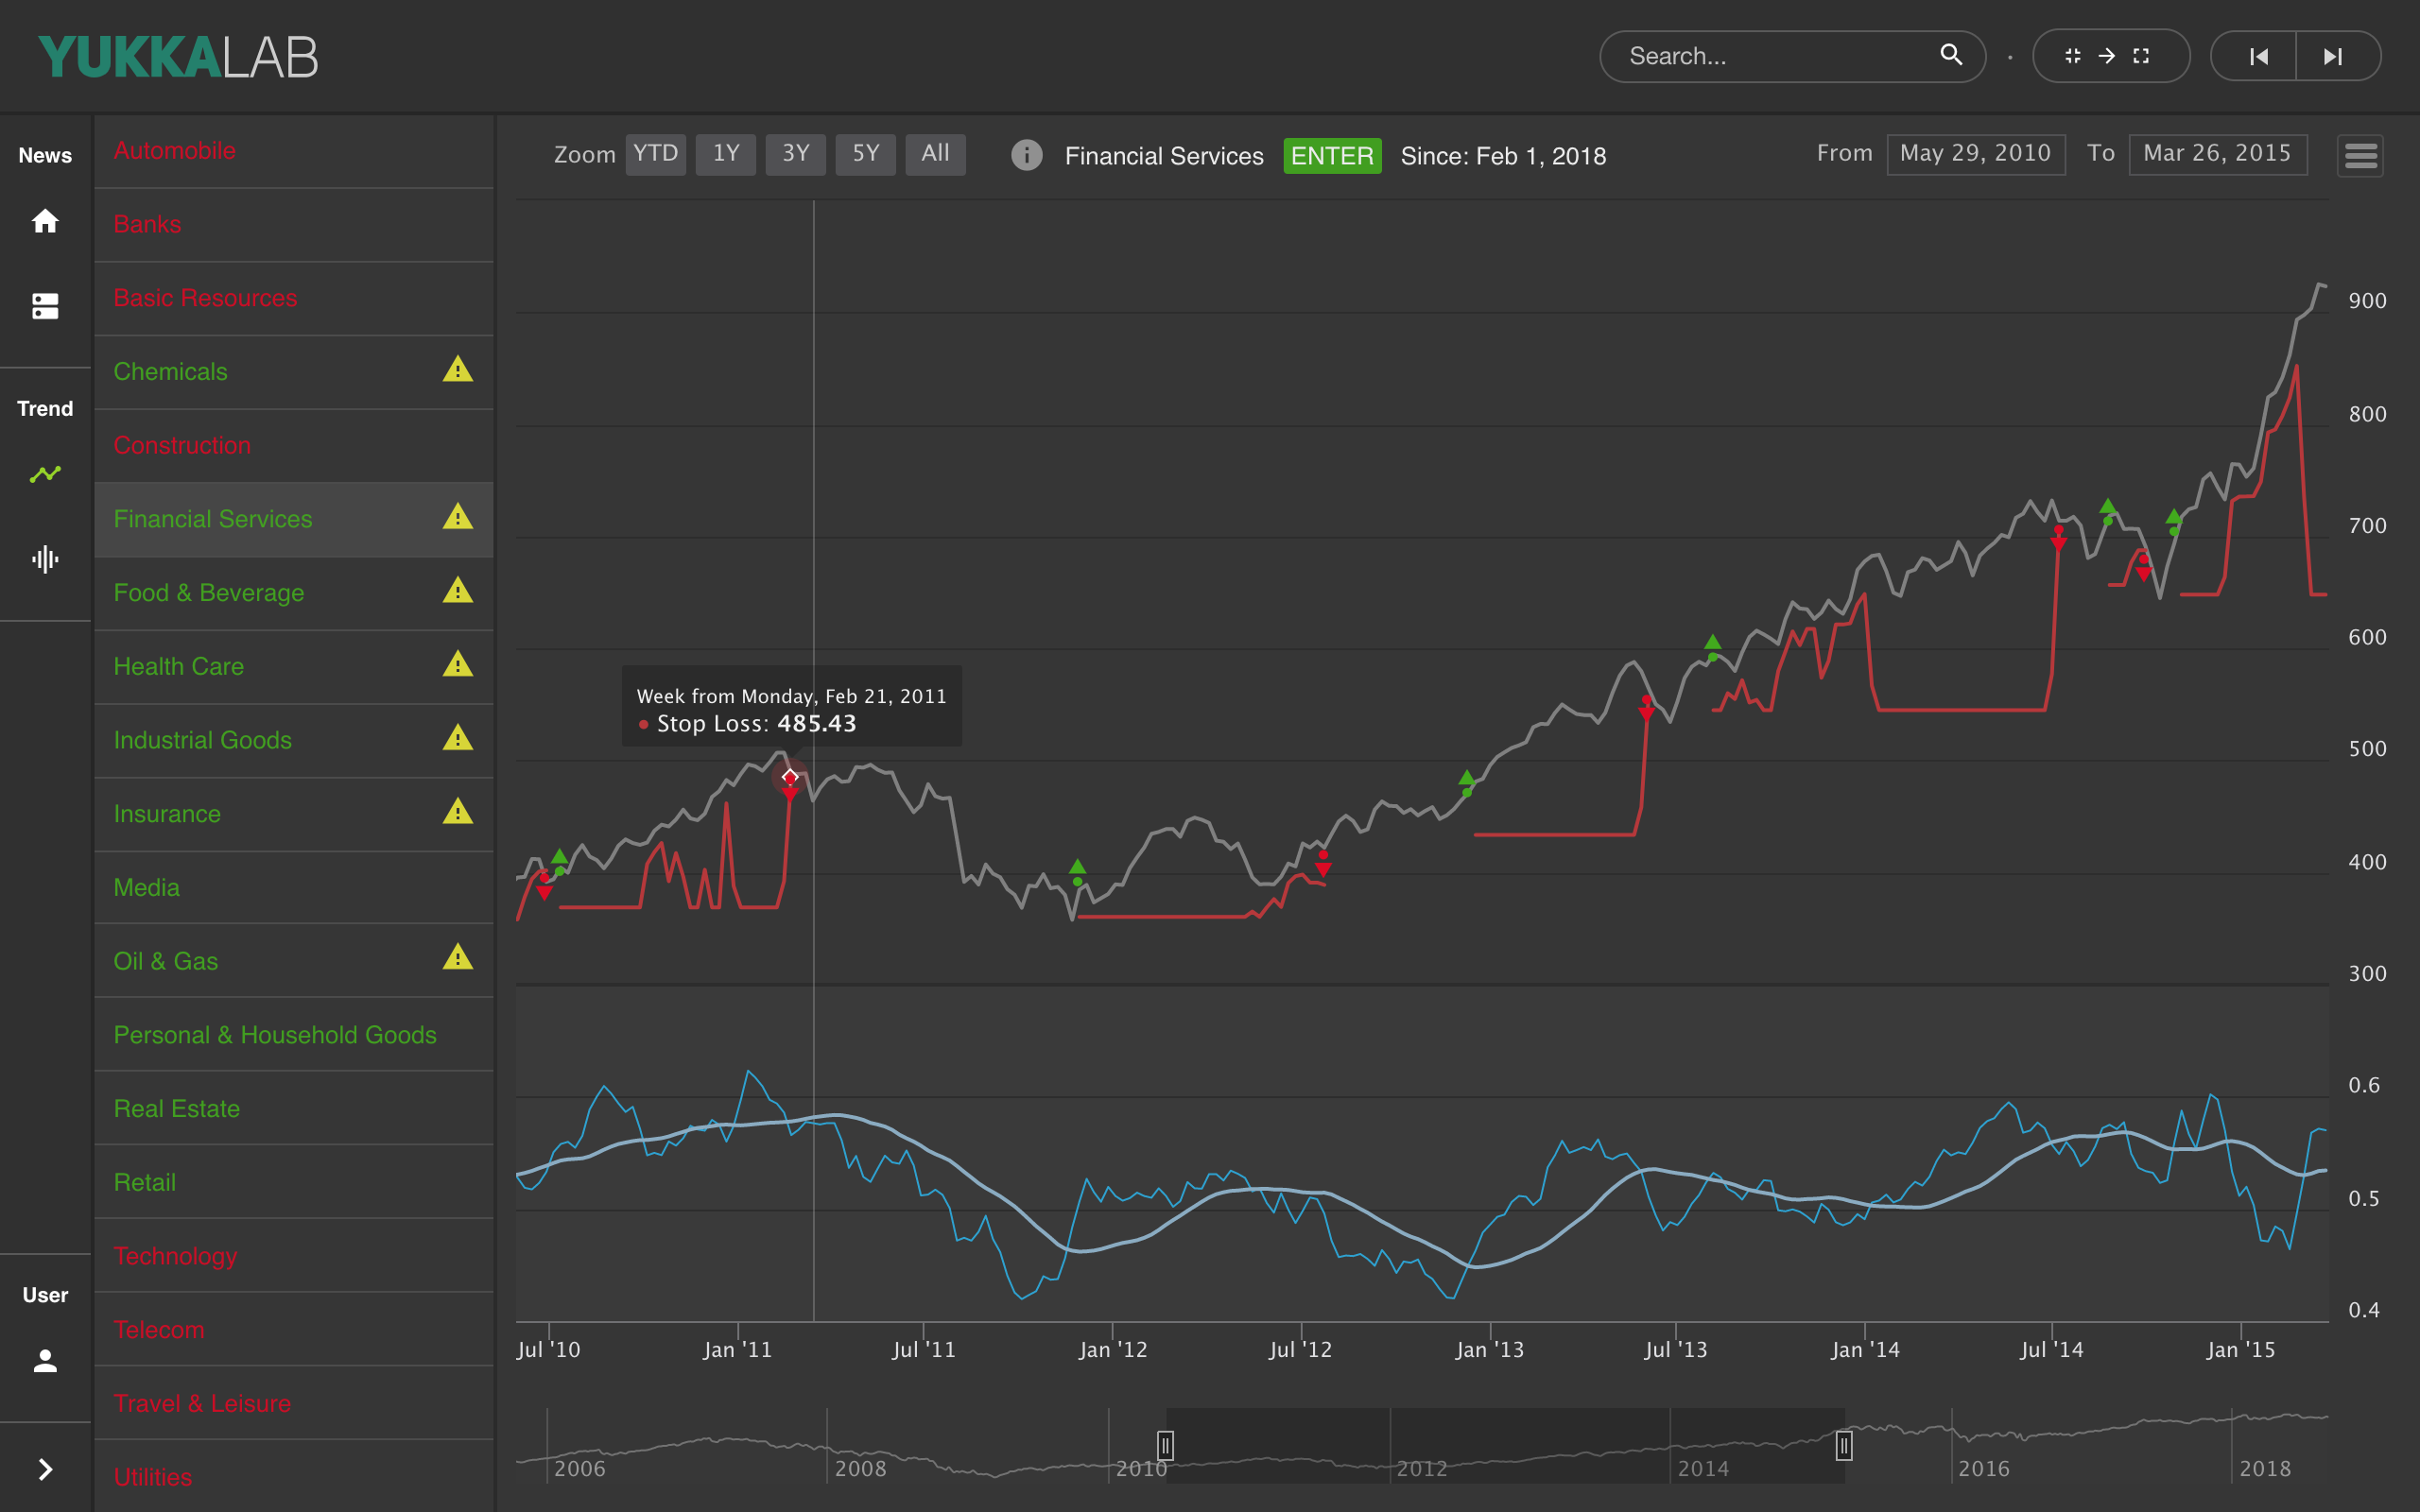
This project was part of the cockpit of Yukkalab it displays the stock of different markets using Highcharts, Angular and Material. The chart is composed of 4 series, 2 of them combined together to show the negative or positive evaluation with an area chart wi…